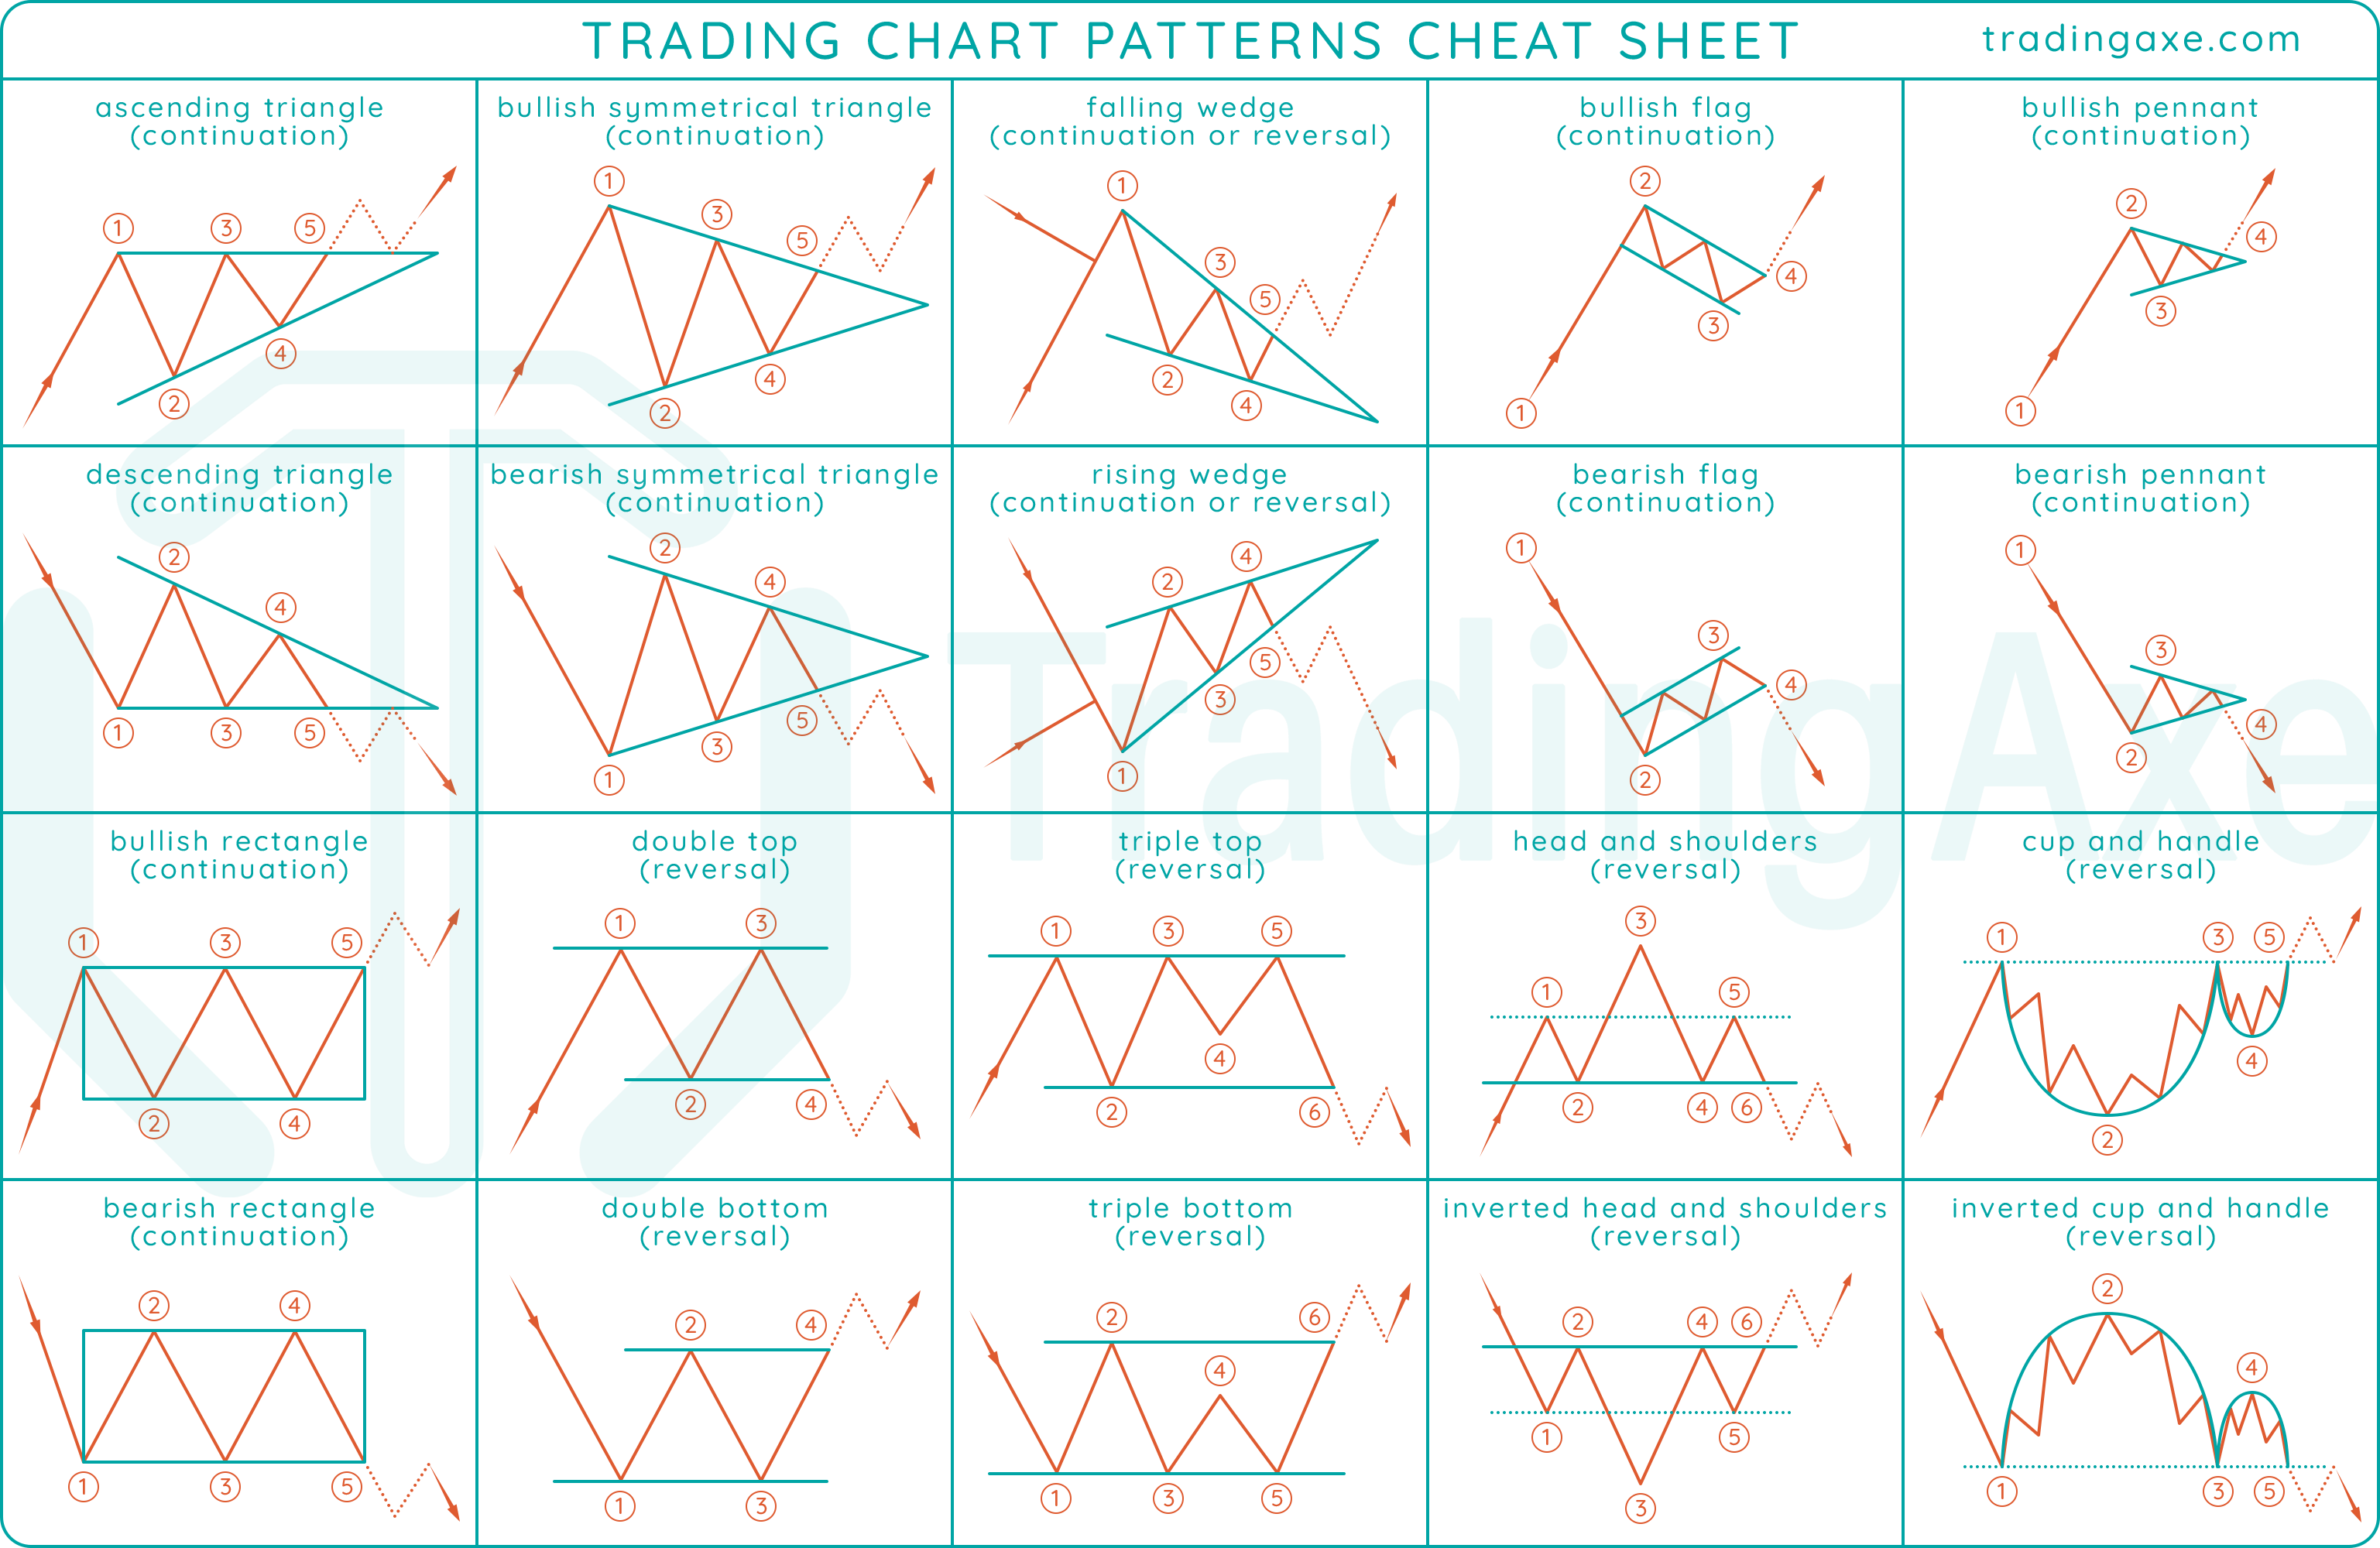
TRADING CHART PATTERNS CHARACTERISTICS
| PATTERN | DIRECTION | TYPE | OCCURENCE | COMMON TERM |
|---|---|---|---|---|
| ascending triangle | continuation | bullish | high | all |
| descending triangle | continuation | bearish | high | all |
| bullish symmetrical triangle | continuation | bullish | high | all |
| bearish symmetrical triangle | continuation | bearish | high | all |
| falling wedge | neutral | bullish | medium | all |
| rising wedge | neutral | bearish | medium | all |
| bullish rectangle | continuation | bullish | high | all |
| bearish rectangle | continuation | bearish | high | all |
| double top | reversal | bearish | high | all |
| double bottom | reversal | bullish | high | all |
| triple top | reversal | bearish | medium | all |
| triple bottom | reversal | bullish | medium | all |
| bullish flag | continuation | bullish | high | short - medium |
| bearish flag | continuation | bearish | high | short - medium |
| bullish pennant | continuation | bullish | high | short - medium |
| bearish pennant | continuation | bearish | high | short - medium |
| head and shoulders | reversal | bearish | low | medium - long |
| inverted head and shoulders | reversal | bullish | low | medium - long |
| cup and handle | continuation | bullish | low | medium - long |
| inverted cup and handle | continuation | bearish | low | medium - long |
TRADING CHART PATTERNS TAKE PROFIT & STOP LOSS
| PATTERN | TAKE PROFIT | STOP LOSS #1 | STOP LOSS #2 |
|---|---|---|---|
| ascending triangle | pip distance of the first swing, applied from breakout rate | border breakout rate | last touch to the border opposite to the breakout border |
| descending triangle | |||
| bullish symmetrical triangle | |||
| bearish symmetrical triangle | |||
| falling wedge | |||
| rising wedge | |||
| bullish rectangle | pip distance between upper and lower borders, applied from breakout rate | border breakout rate | N/A |
| bearish rectangle | |||
| double top | |||
| double bottom | |||
| triple top | |||
| triple bottom | |||
| bullish flag | pip distance of the pole, applied from breakout rate | flag's lowest low | N/A |
| bearish flag | flag's highest high | ||
| bullish pennant | pennant's lowest low | ||
| bearish pennant | pennant's highest high | ||
| head and shoulders | pip distance of the swing between head and right shoulder, applied from breakout rate | neckline's breakout rate | right shoulder's high |
| inverted head and shoulders | right shoulder's low | ||
| cup and handle | pip distance from cup's peak to the rate connecting the cup to its handle, applied from breakout rate | cup's surface breakout rate | handle's peak |
| inverted cup and handle |
DIFFERENTIATE TRIANGLE CHART PATTERNS
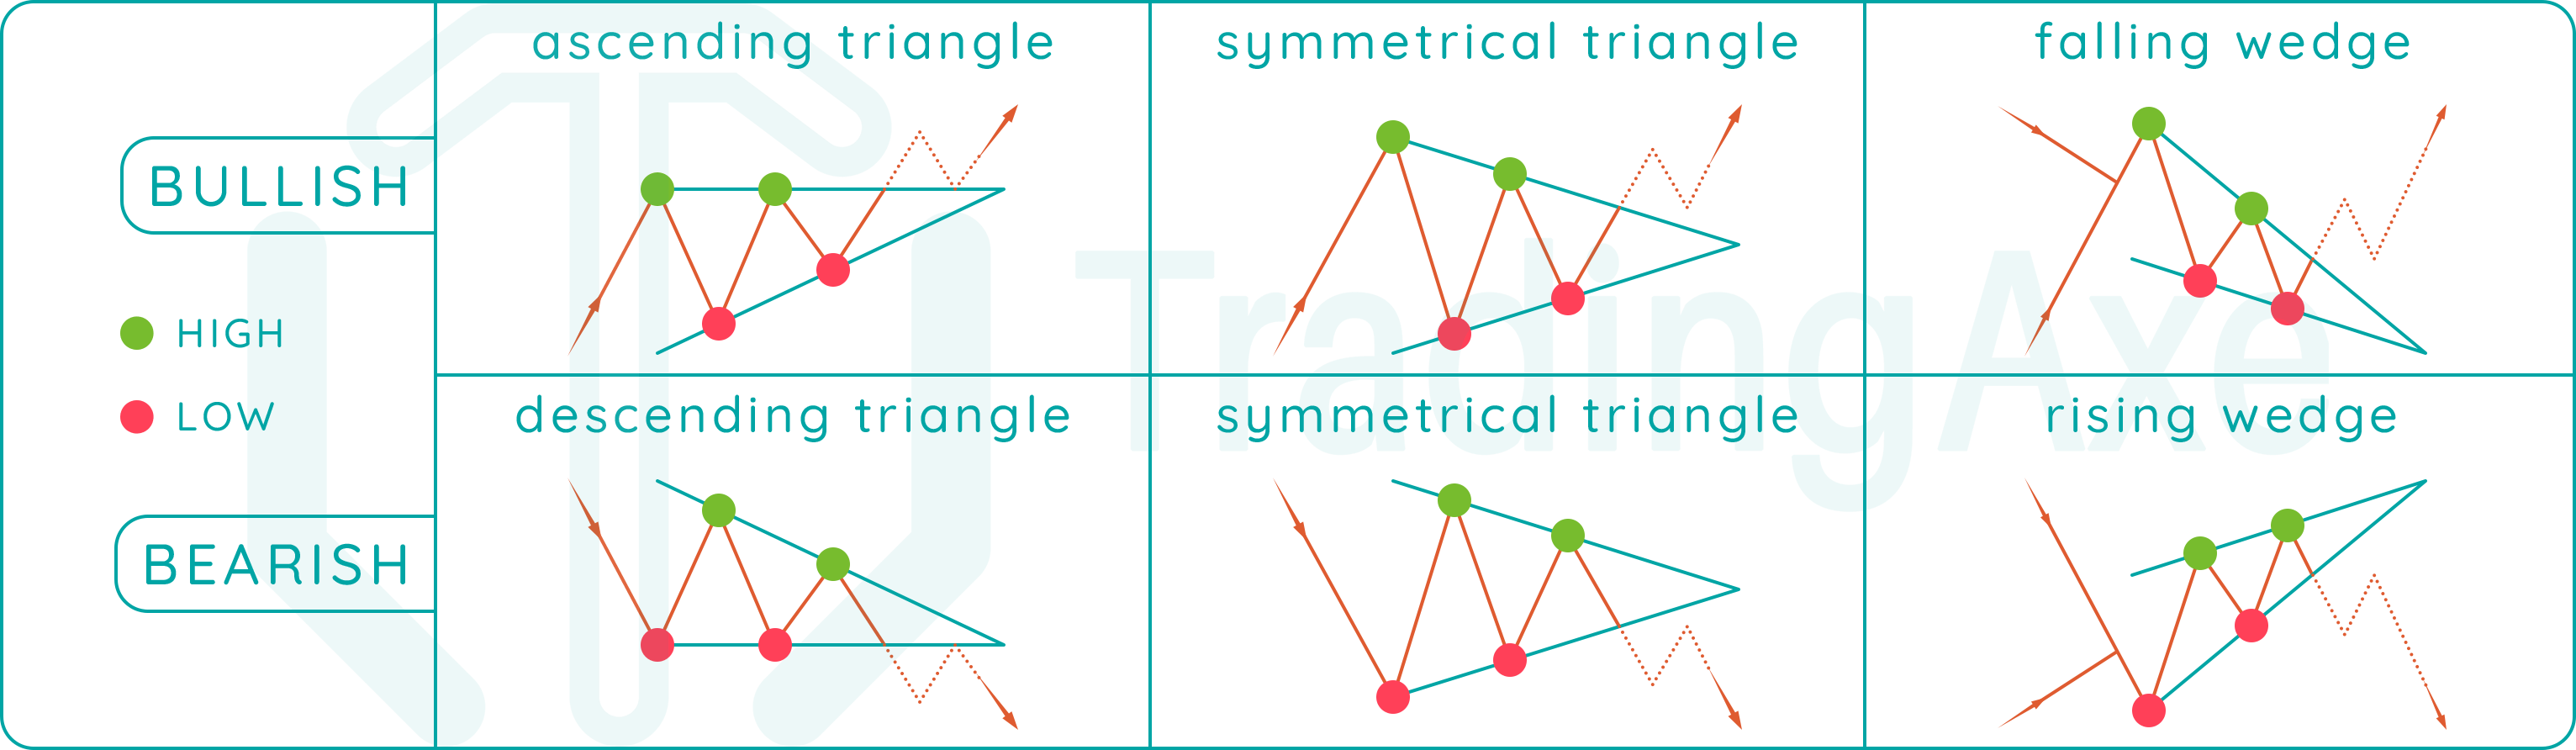
| ascending triangle | equal highs |
|---|---|
| higher lows | |
| prior trend: bullish | |
| descending triangle | lower highs |
| equal lows | |
| prior trend: bearish | |
| bullish symmetrical triangle | lower highs |
| higher lows | |
| prior trend: bullish | |
| bearish symmetrical triangle | lower highs |
| higher lows | |
| prior trend: bearish | |
| falling wedge | lower highs |
| lower lows | |
| prior trend: neutral | |
| rising wedge | higher highs |
| higher lows | |
| prior trend: neutral |
DIFFERENTIATE RECTANGLE CHART PATTERNS
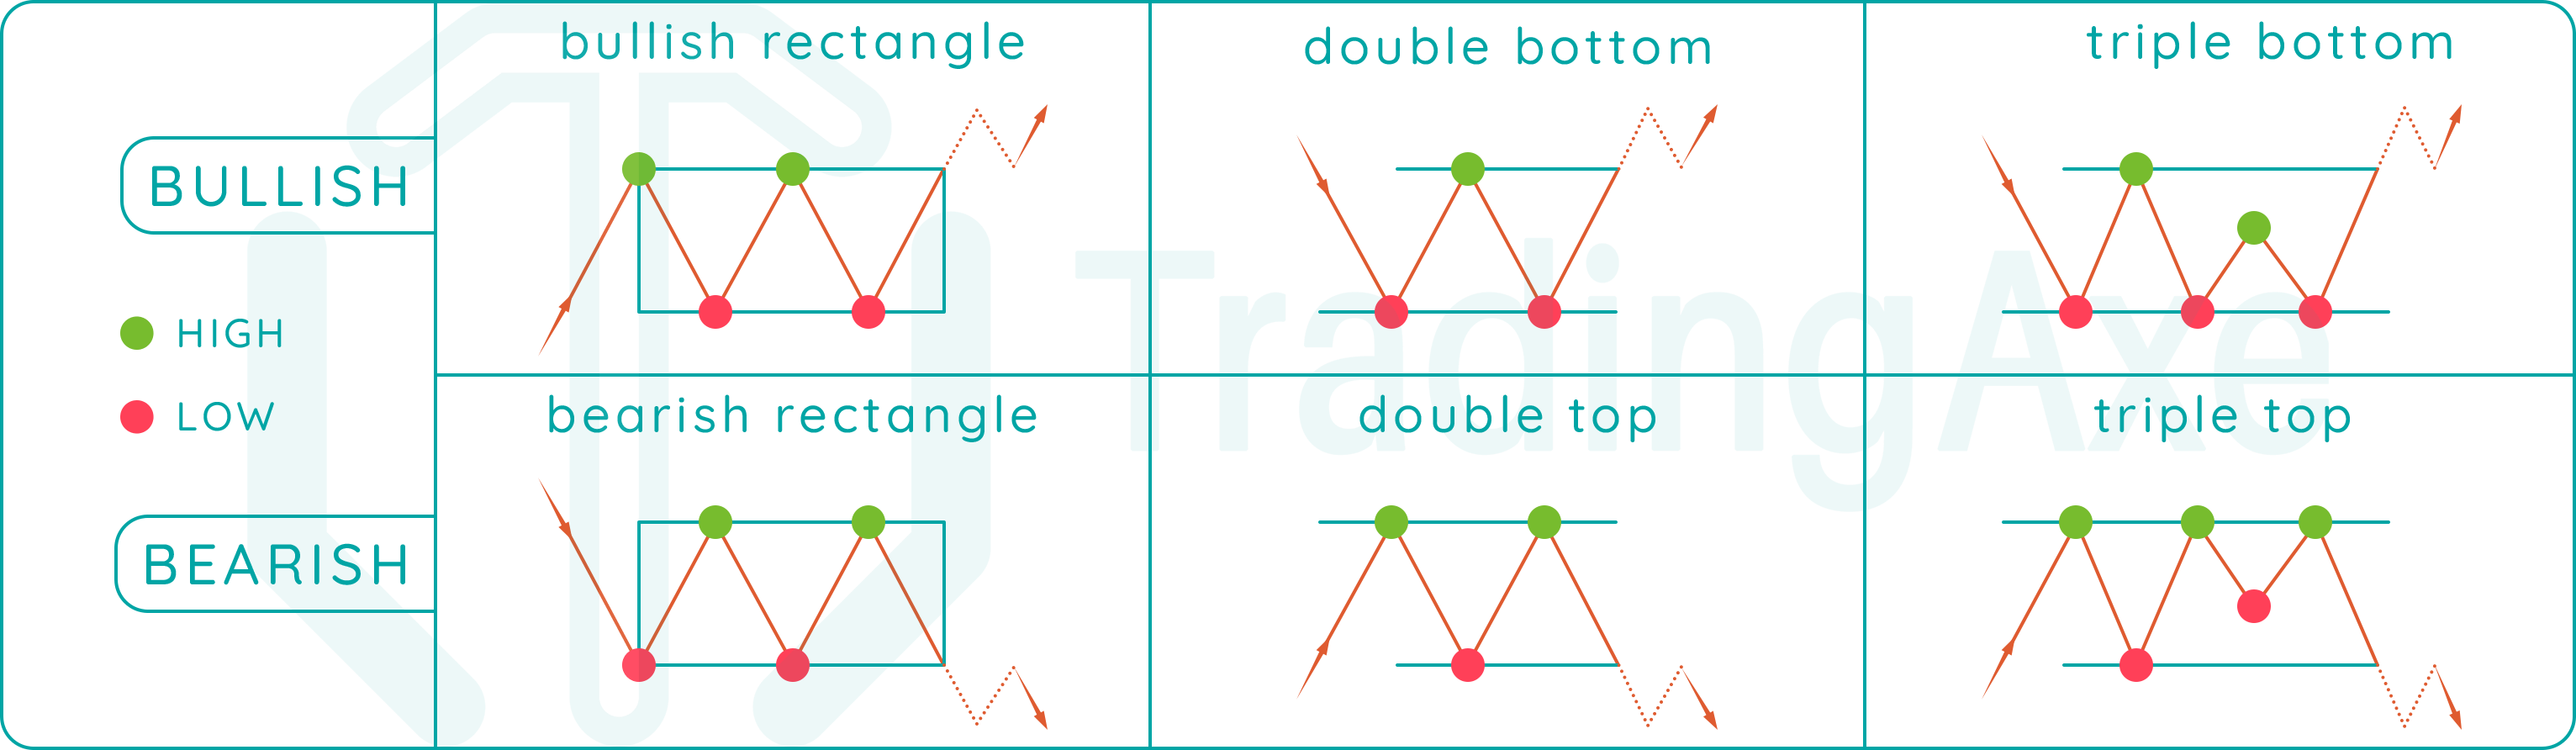
| bullish rectangle | equal highs |
|---|---|
| equal lows | |
| prior trend: bullish | |
| bearish rectangle | equal highs |
| equal lows | |
| prior trend: bearish | |
| double bottom | single high |
| 2 equal lows | |
| prior trend: bearish | |
| double top | 2 equal highs |
| single low | |
| prior trend: bullish | |
| triple bottom | 2 unequal highs |
| 3 equal lows | |
| prior trend: bearish | |
| triple top | 3 equal highs |
| 2 unequal lows | |
| prior trend: bullish |
DIFFERENTIATE POLE CHART PATTERNS
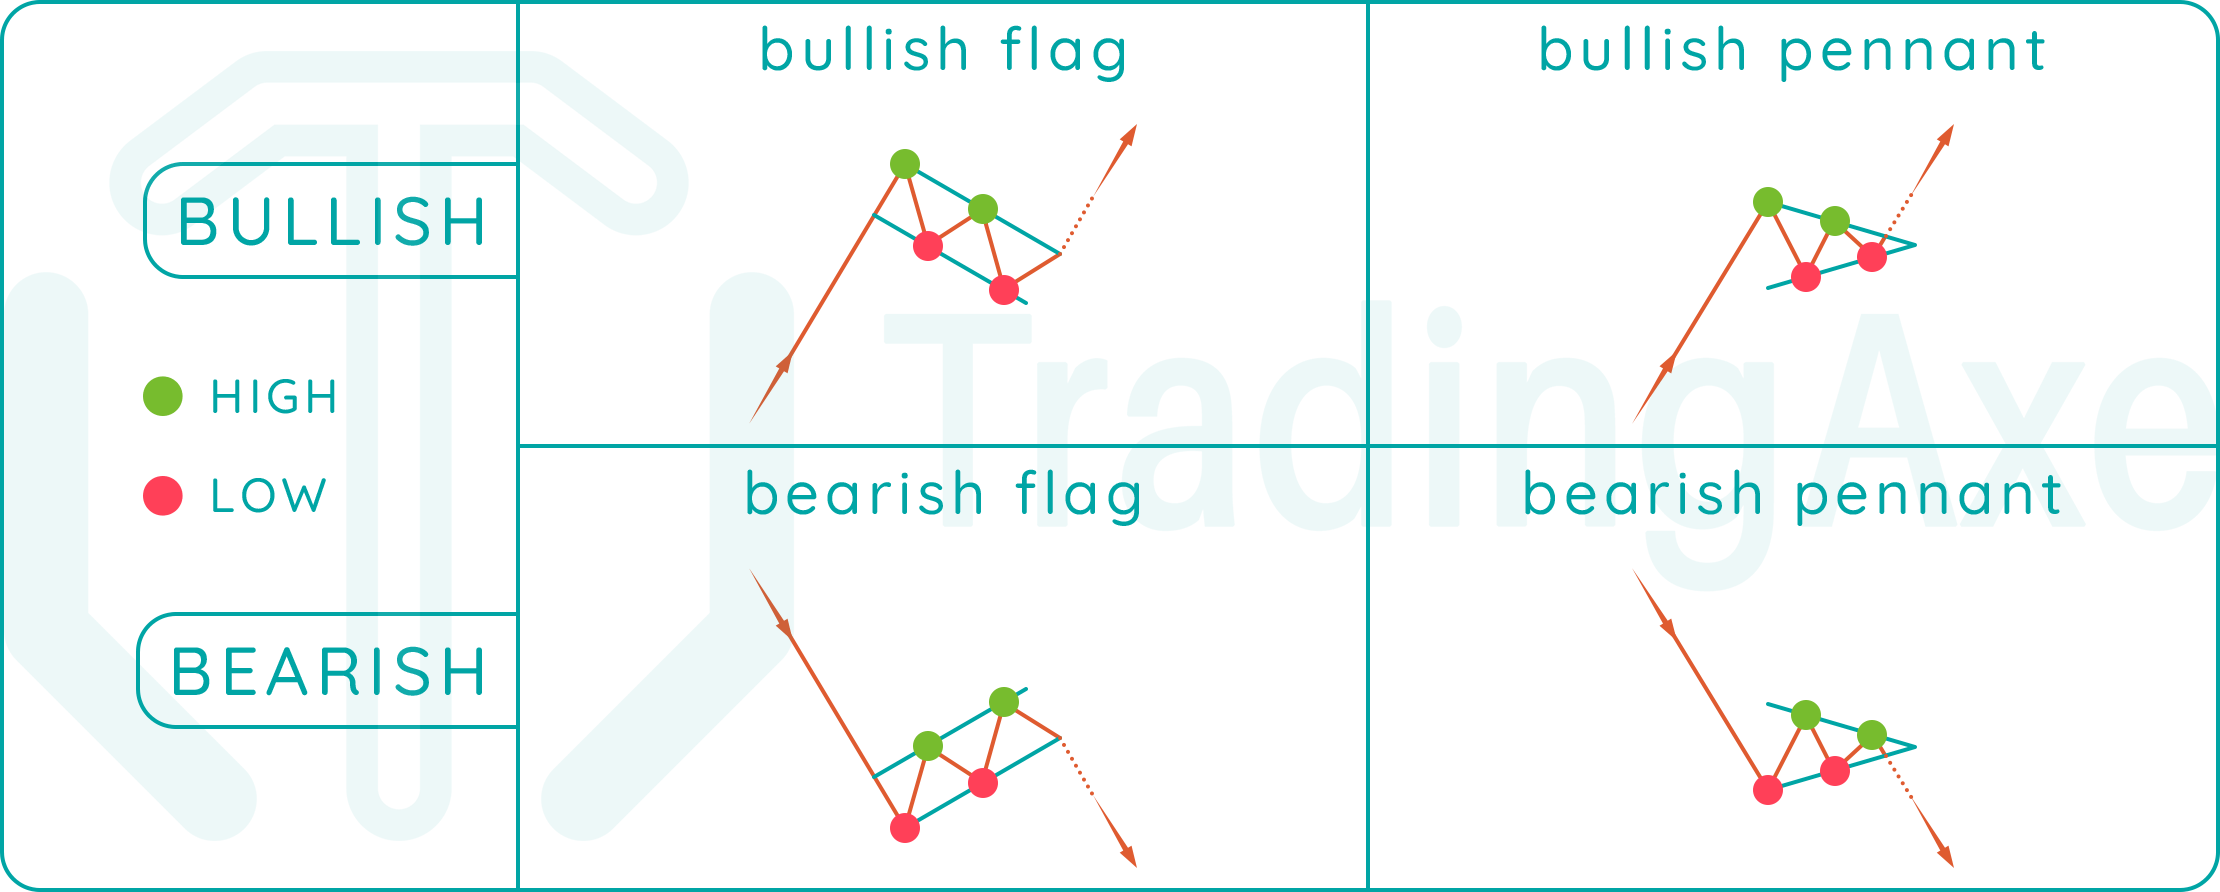
| bullish flag | lower highs |
|---|---|
| lower lows | |
| pole: sharp bullish | |
| bearish flag | higher highs |
| higher lows | |
| pole: sharp bearish | |
| bullish pennant | lower highs |
| higher lows | |
| pole: sharp bullish | |
| bearish pennant | lower highs |
| higher lows | |
| pole: sharp bearish |