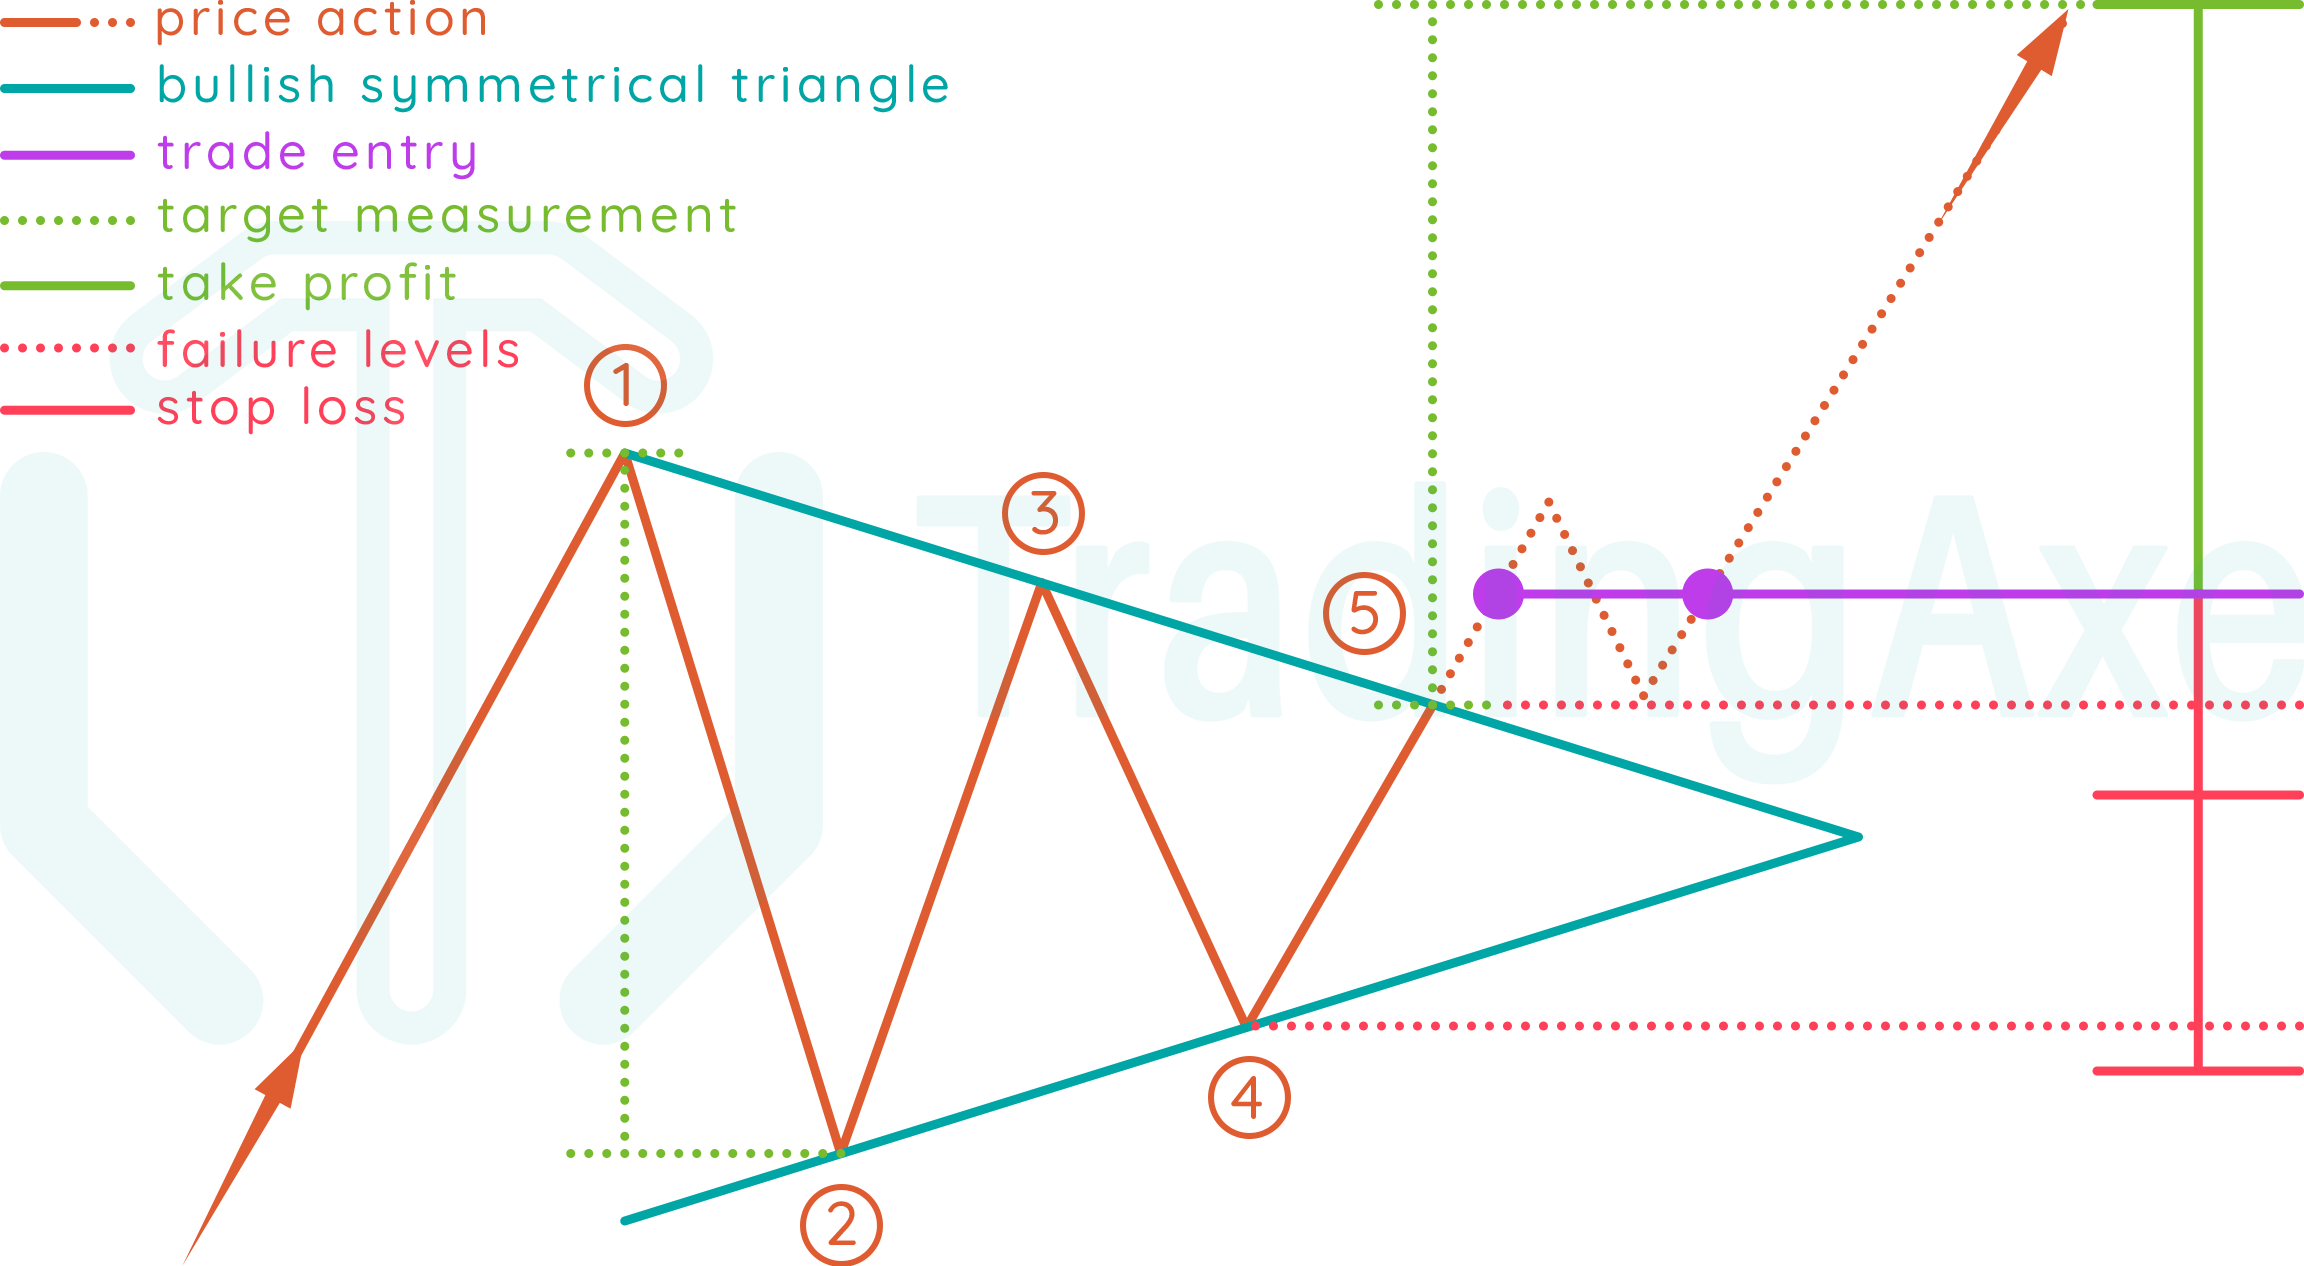
Entry: after breaking the triangle's upper border at point (5), either with an entry after the breakout, or after a possible retest of the upper border's breakout rate.
Take profit: identified by measuring the vertical distance between the first resistance (1) and the first support (2), that measurement is then applied from the breakout rate (5)
Stop loss: can either be the breakout rate (5), or the last touch to the triangle's lower border (4) before the breakout
BULLISH SYMMETRICAL TRIANGLE PRICE ACTION
This chart pattern starts forming with bulls already in control of the exchange rate's uptrend. Then both bears and bulls try to squeeze on each other by creating lower highs and higher lows respectively, till the bulls finally break the triangle's upper border created by the bears, and the exchange rate continues its uptrend.
Let's break down the pattern formation!
In an uptrend, price action finds the first resistance (1), which will be the highest high in the pattern.
Price action reverses direction from the first resistance (1) and goes downwards till it finds the first support (2), which will be the lowest low in the pattern.
Price action reverses direction from the first support (2) and goes upwards, till it finds the second resistance (3), which must be lower than the first resistance (1)
Price action reverses direction from the second resistance (3) and goes downwards, till it finds the second support (4), which must be higher than the first support (2)
The pattern is completed when price action reverses direction from the second support (4) and goes upwards till it breaks the triangle's upper border at point (5)
NOTES ON BULLISH SYMMETRICAL TRIANGLE
Direction
Continuation
Type
Bullish
Occurrence
High
Common term
All
Before the breakout, 4 touches to the triangle's upper and lower borders are the minimum for a valid pattern, more touches are acceptable.
Although named symmetrical, upper and lower borders don't have to be perfectly symmetrical, as long as lower highs (1-3-…) and higher lows (2-4-…) are being formed, the pattern is considered valid.
The breakout of the pattern is expected at around (half / two thirds) the triangle formation, measured from the first resistance (1) to the intersection point of upper and lower borders.
The most common direction of the pattern is a continuation, but that doesn't rule out the existence of reversal symmetrical triangles. The target measurement in that case will be applied from the lower border's breakout rate.
Volume usually decreases as the pattern is being formed, and increases when breaking or retesting the triangle's upper border breakout rate (5)
This pattern is commonly found on all time frames.
BULLISH SYMMETRICAL TRIANGLE REWARD:RISK
When using the triangle's upper border breakout rate as stop loss, R:R will depend on the (breakout rate-entry rate) distance, compared to the target measurement (1-2) distance.
When using the last touch before the breakout (4) as stop loss, the pattern's R:R improves when that touch is near the end of the triangle, as well as when the lower border's up-slope is sharper.
Always remember that both stop loss levels explained above are absolute, the actual stop loss rate for your trade setup should be a bit beyond those levels to give the trade setup some room to breathe, and of course, calculations for position size and R:R should be done with respect to those rates.
