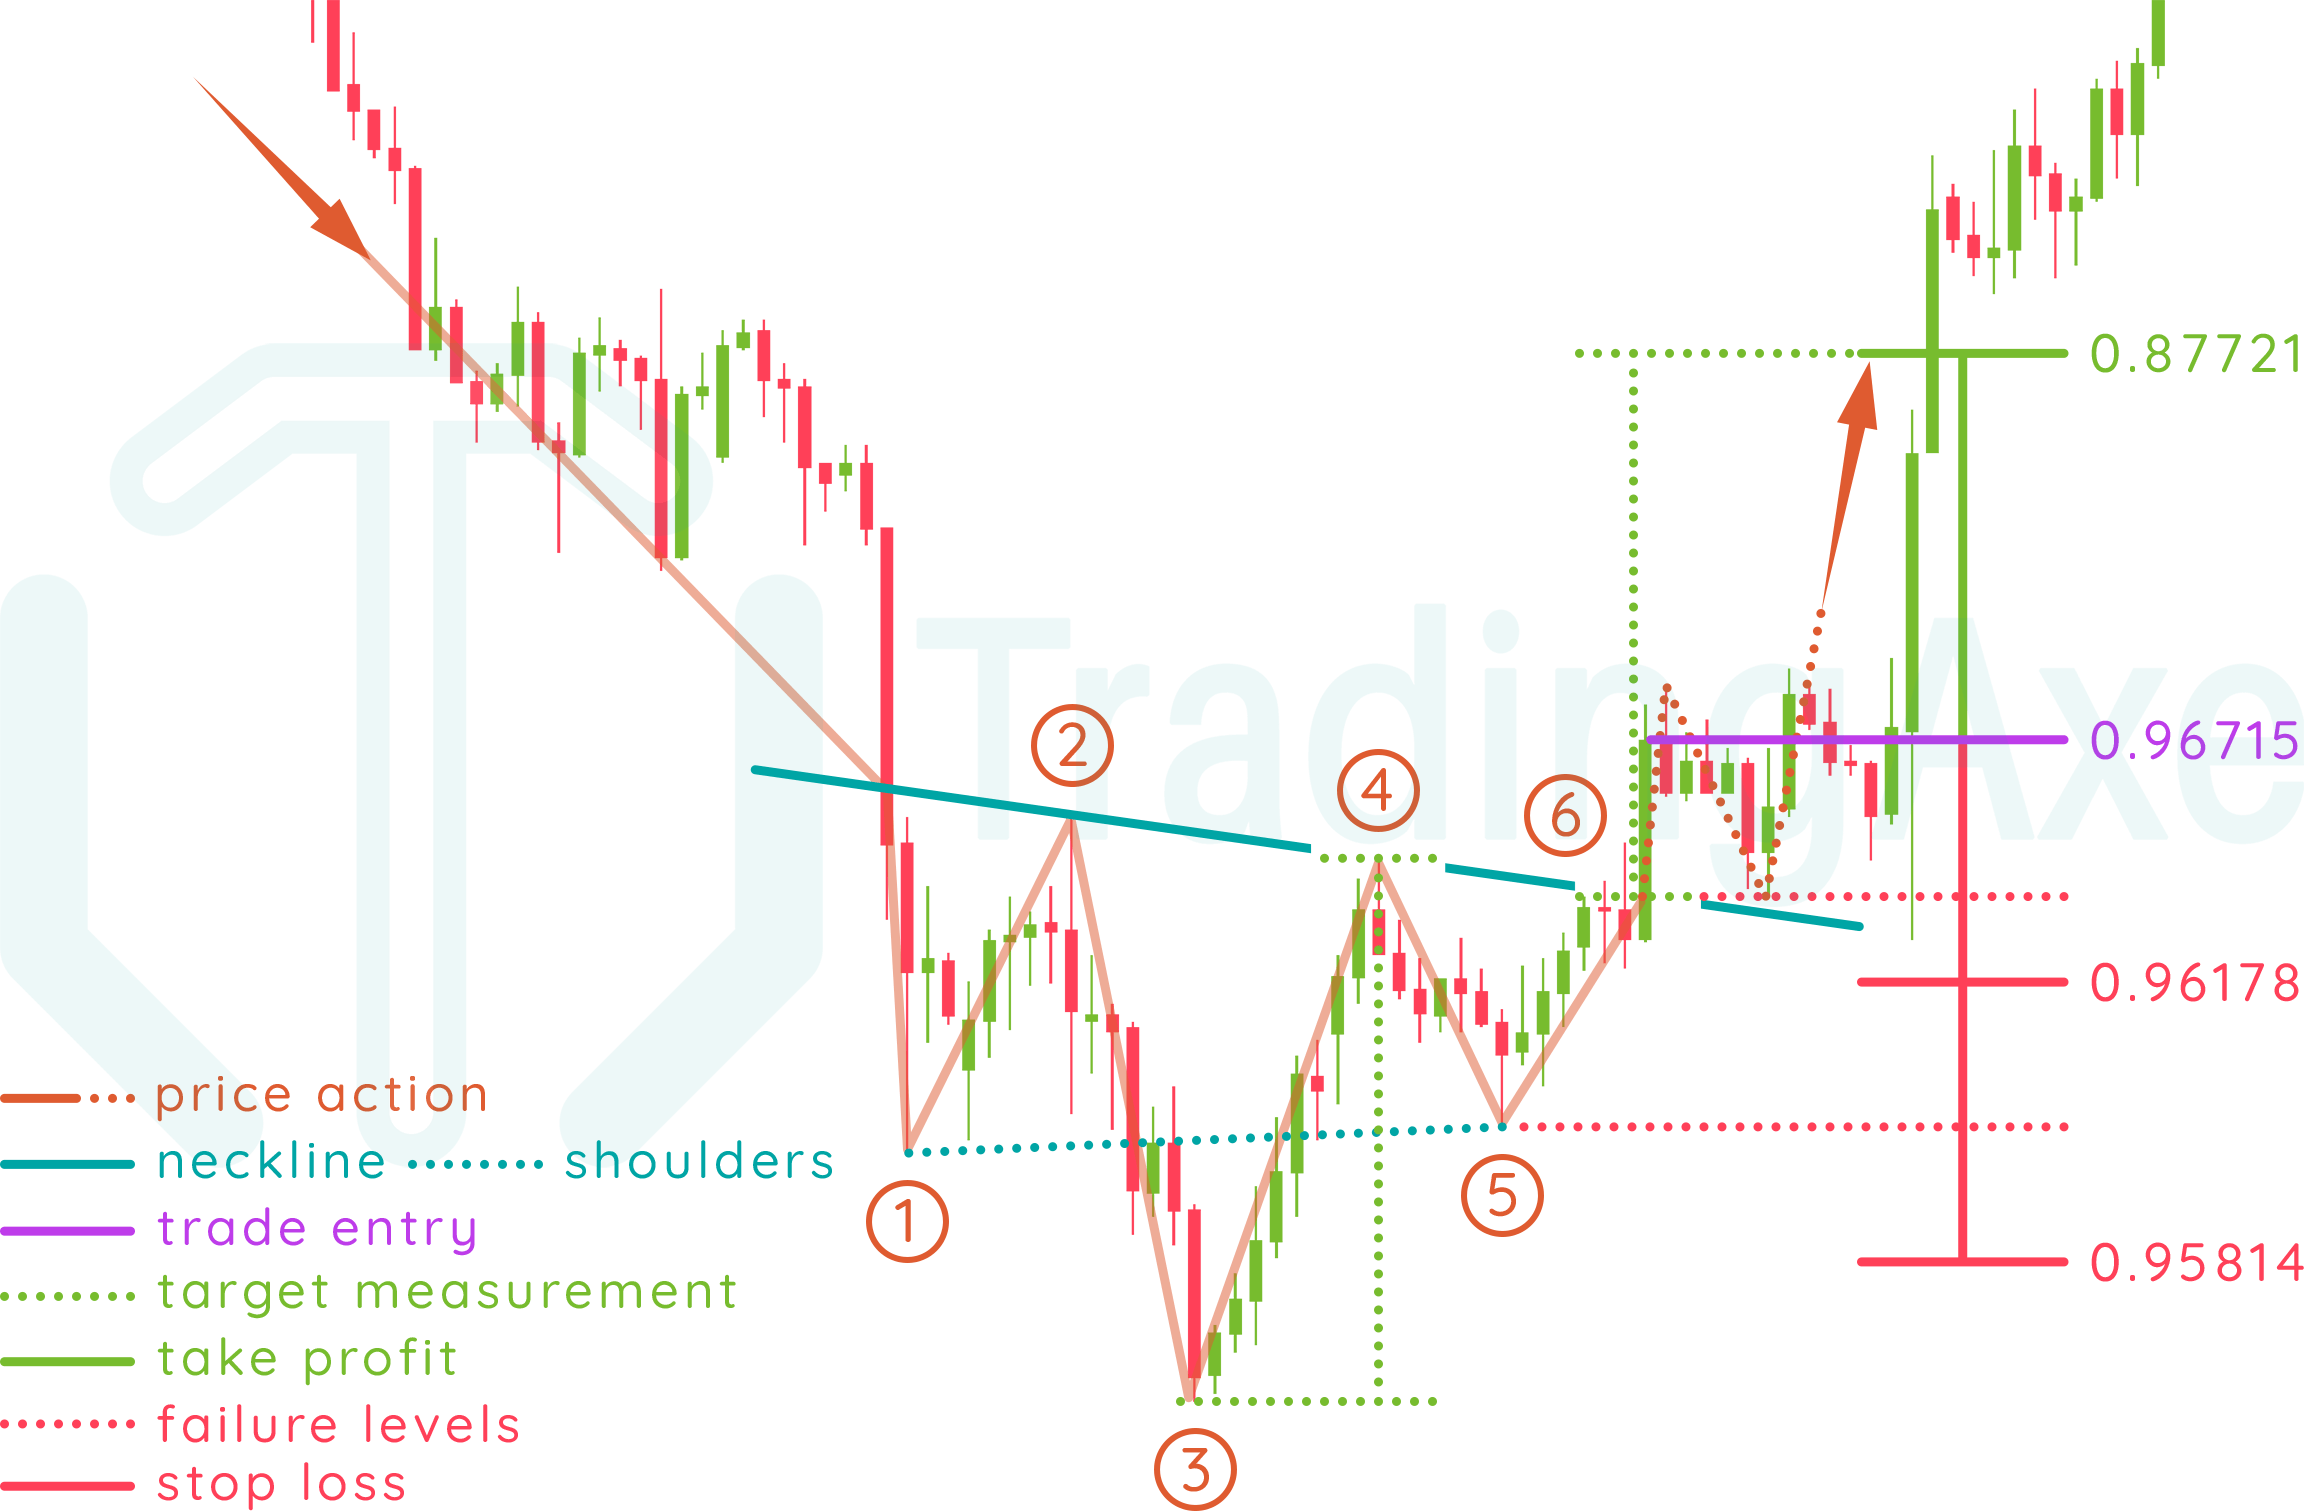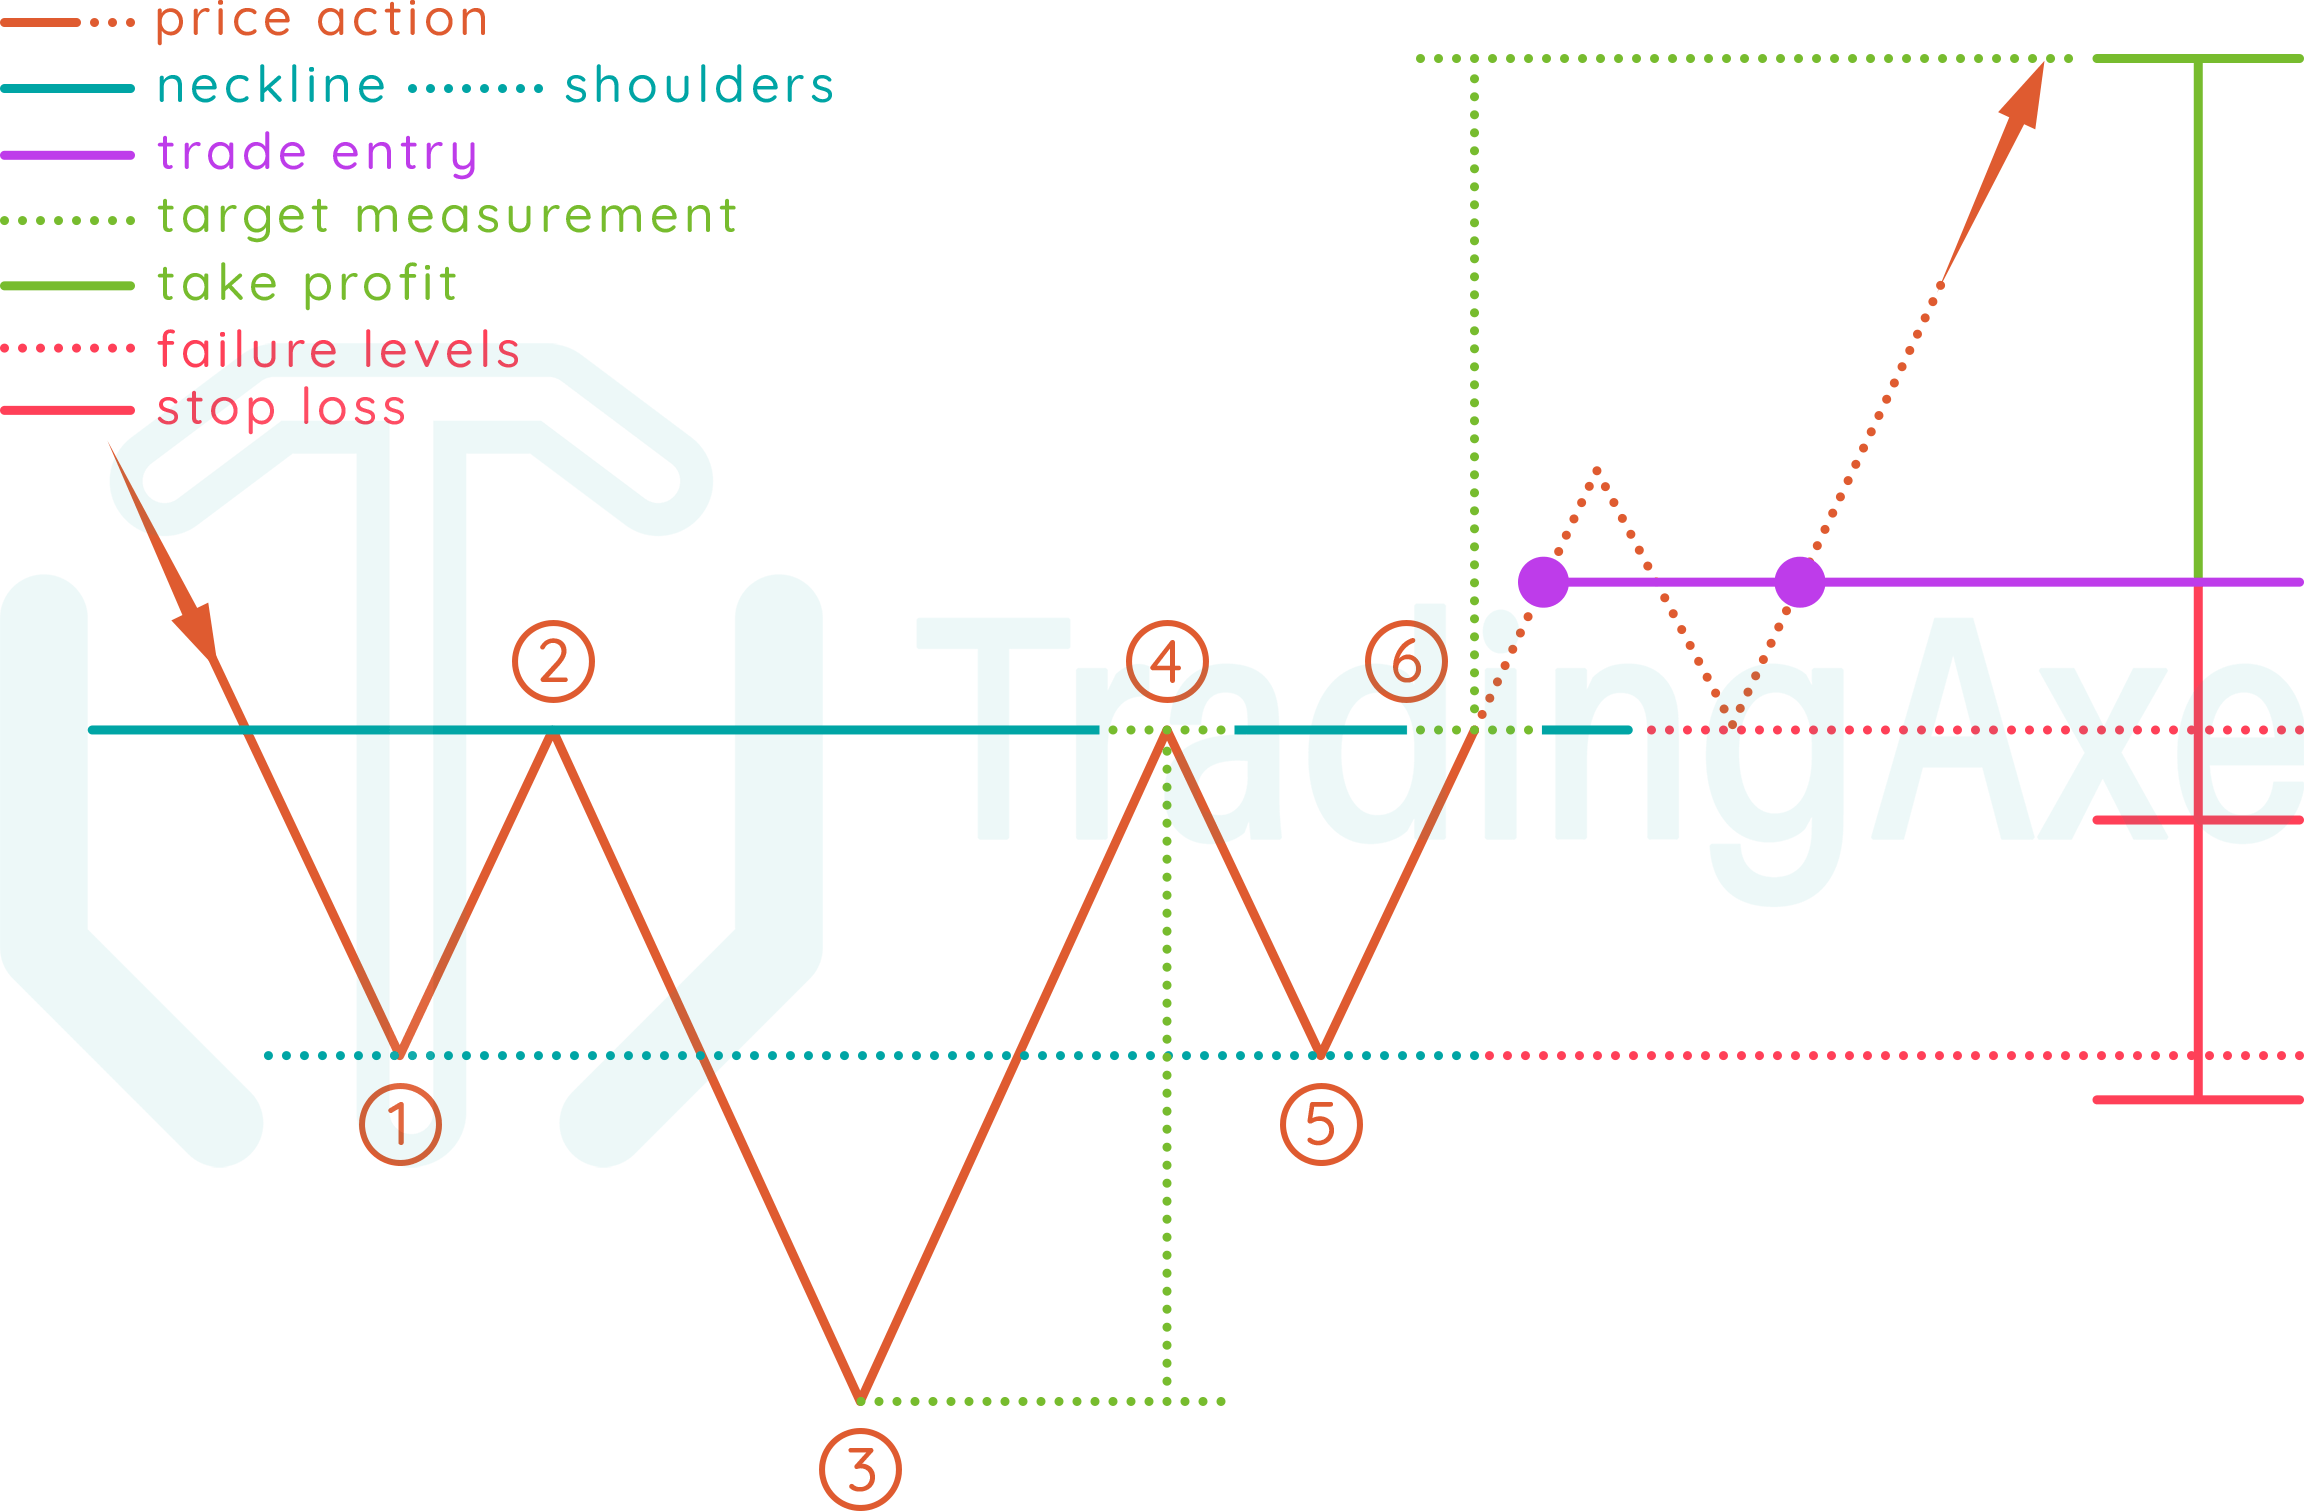
Entry: after breaking the neckline at point (6), either with an entry after the breakout, or after a possible retest of the neckline.
Take profit: identified by measuring the vertical distance from the head (3) to the reversal point from neckline that initiated the right shoulder (4), that measurement is then applied from the breakout rate (6)
Stop loss: can either be the neckline breakout rate (6), or the right shoulder's low (5)
INVERTED HEAD AND SHOULDERS PRICE ACTION
This chart pattern starts forming with bears already in control of the exchange rate's downtrend. As bulls enter the market, they are tested by the bears at three different occasions, the first and third ones are around the same rate, and the second one being the strongest push performed by the bears. After the third bulls' successful reversal, they finally break the neckline created by the bears, and the exchange rate starts an uptrend.
Let's break down the pattern formation!
In a downtrend, price action finds the first resistance (1) that forms left shoulder's low.
Price action reverses direction from the first resistance (1) and goes upwards till it finds the first support (2), completing the left shoulder formation.
Price action reverses direction from the first support (2) and goes downwards till it finds the second resistance (3) that forms the pattern's head, which must be lower than the first resistance (1)
Price action reverses direction from the second resistance (3) and goes upwards till it finds the second support (4) that completes the head formation, which will be around the same rate of the first support (2)
Price action reverses direction from the second support (4) and goes downwards till it finds the third resistance (5) that forms the right shoulder's low, which will be around the same rate of the first resistance (1).
The pattern is completed when price action reverses direction from the third resistance (5) and goes upwards till it breaks the neckline at point (6)
NOTES ON INVERTED HEAD AND SHOULDERS
Direction
Reversal
Type
Bullish
Occurrence
Low
Common term
Medium-Long
The neckline is identified by drawing and extending a trend line connecting the two support levels that completed the left shoulder (2) and the head (4)
Both shoulders don't have to be of the same height.
Neckline (2-4) can be skewed, usually in the same direction of the trend line connecting both shoulders lows at points (1-5)
Volume usually decreases as the pattern is being formed, and increases when breaking or retesting the neckline.
This pattern is commonly found on medium-term and long-term time frames.
INVERTED HEAD AND SHOULDERS REWARD:RISK
When using the neckline's breakout rate as stop loss, R:R will depend on the (breakout rate-entry rate) distance, compared to the target measurement (head-neckline) distance.
When using the right shoulder's low as stop loss, the pattern's R:R improves when the shoulder's retracement distance (4-5) is short compared to the (head-neckline) distance.
Always remember that both stop loss levels explained above are absolute, the actual stop loss rate for your trade setup should be a bit beyond those levels to give the trade setup some room to breathe, and of course, calculations for position size and R:R should be done with respect to those rates.