HOW TO TRADE BEARISH PENNANT CHART PATTERN

Illustration of how to trade bearish pennant chart pattern

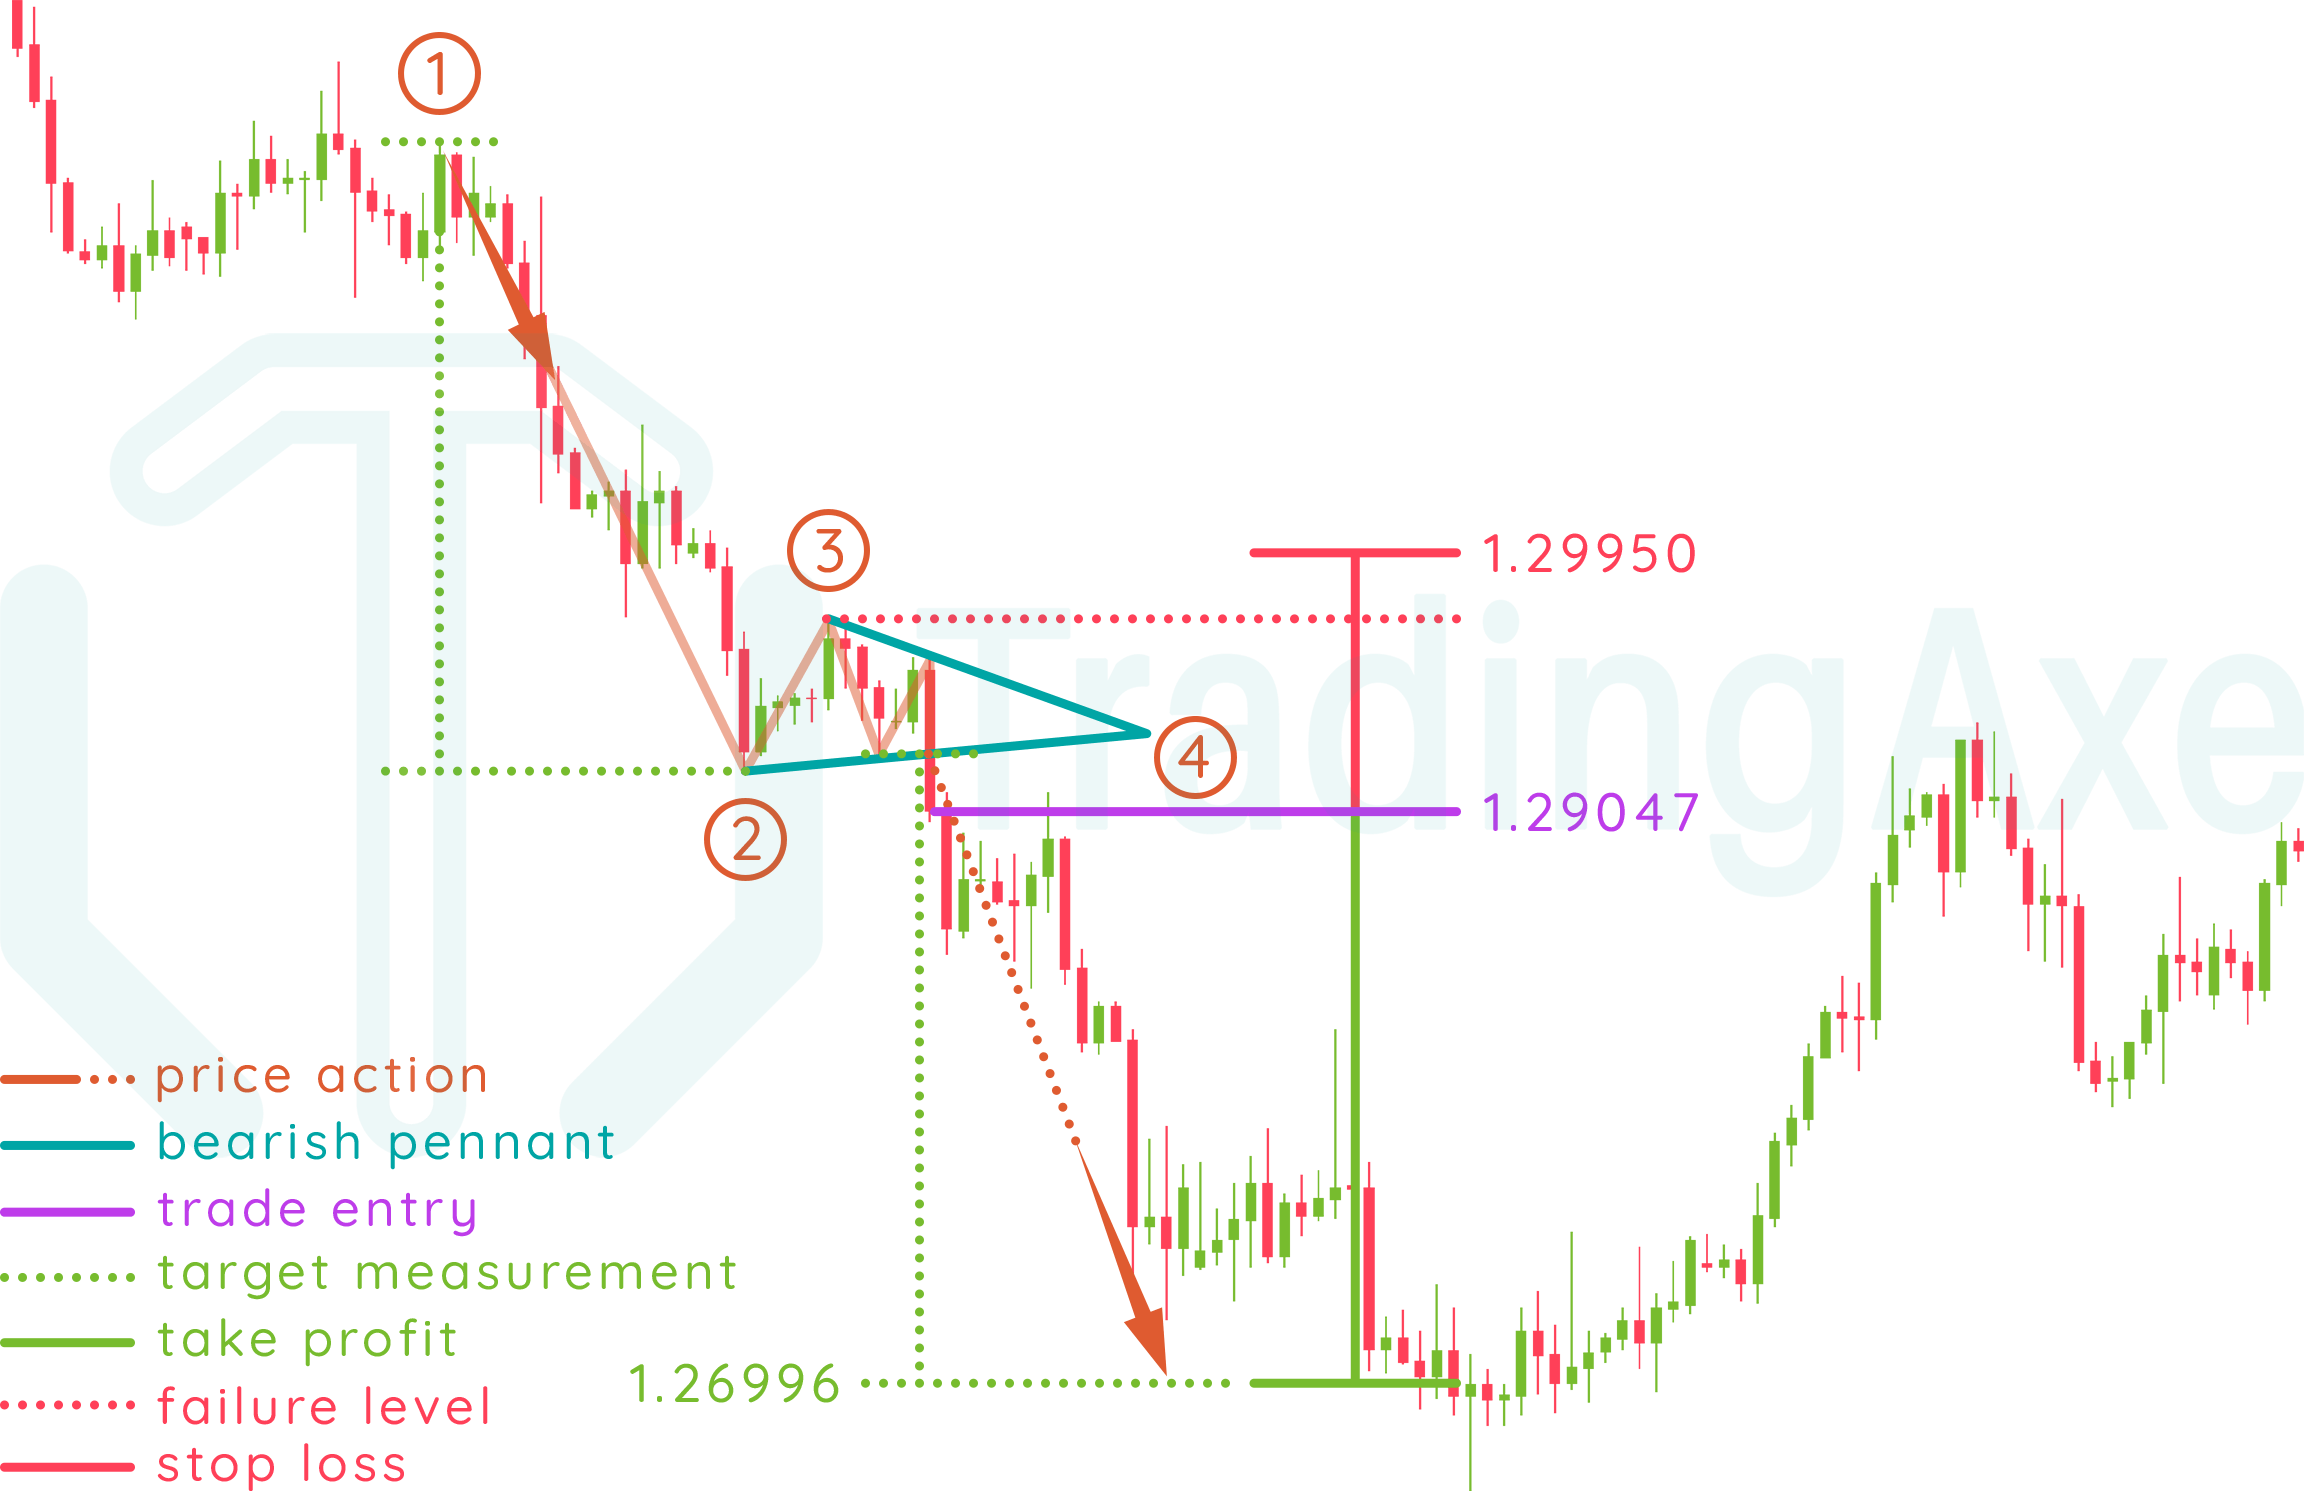
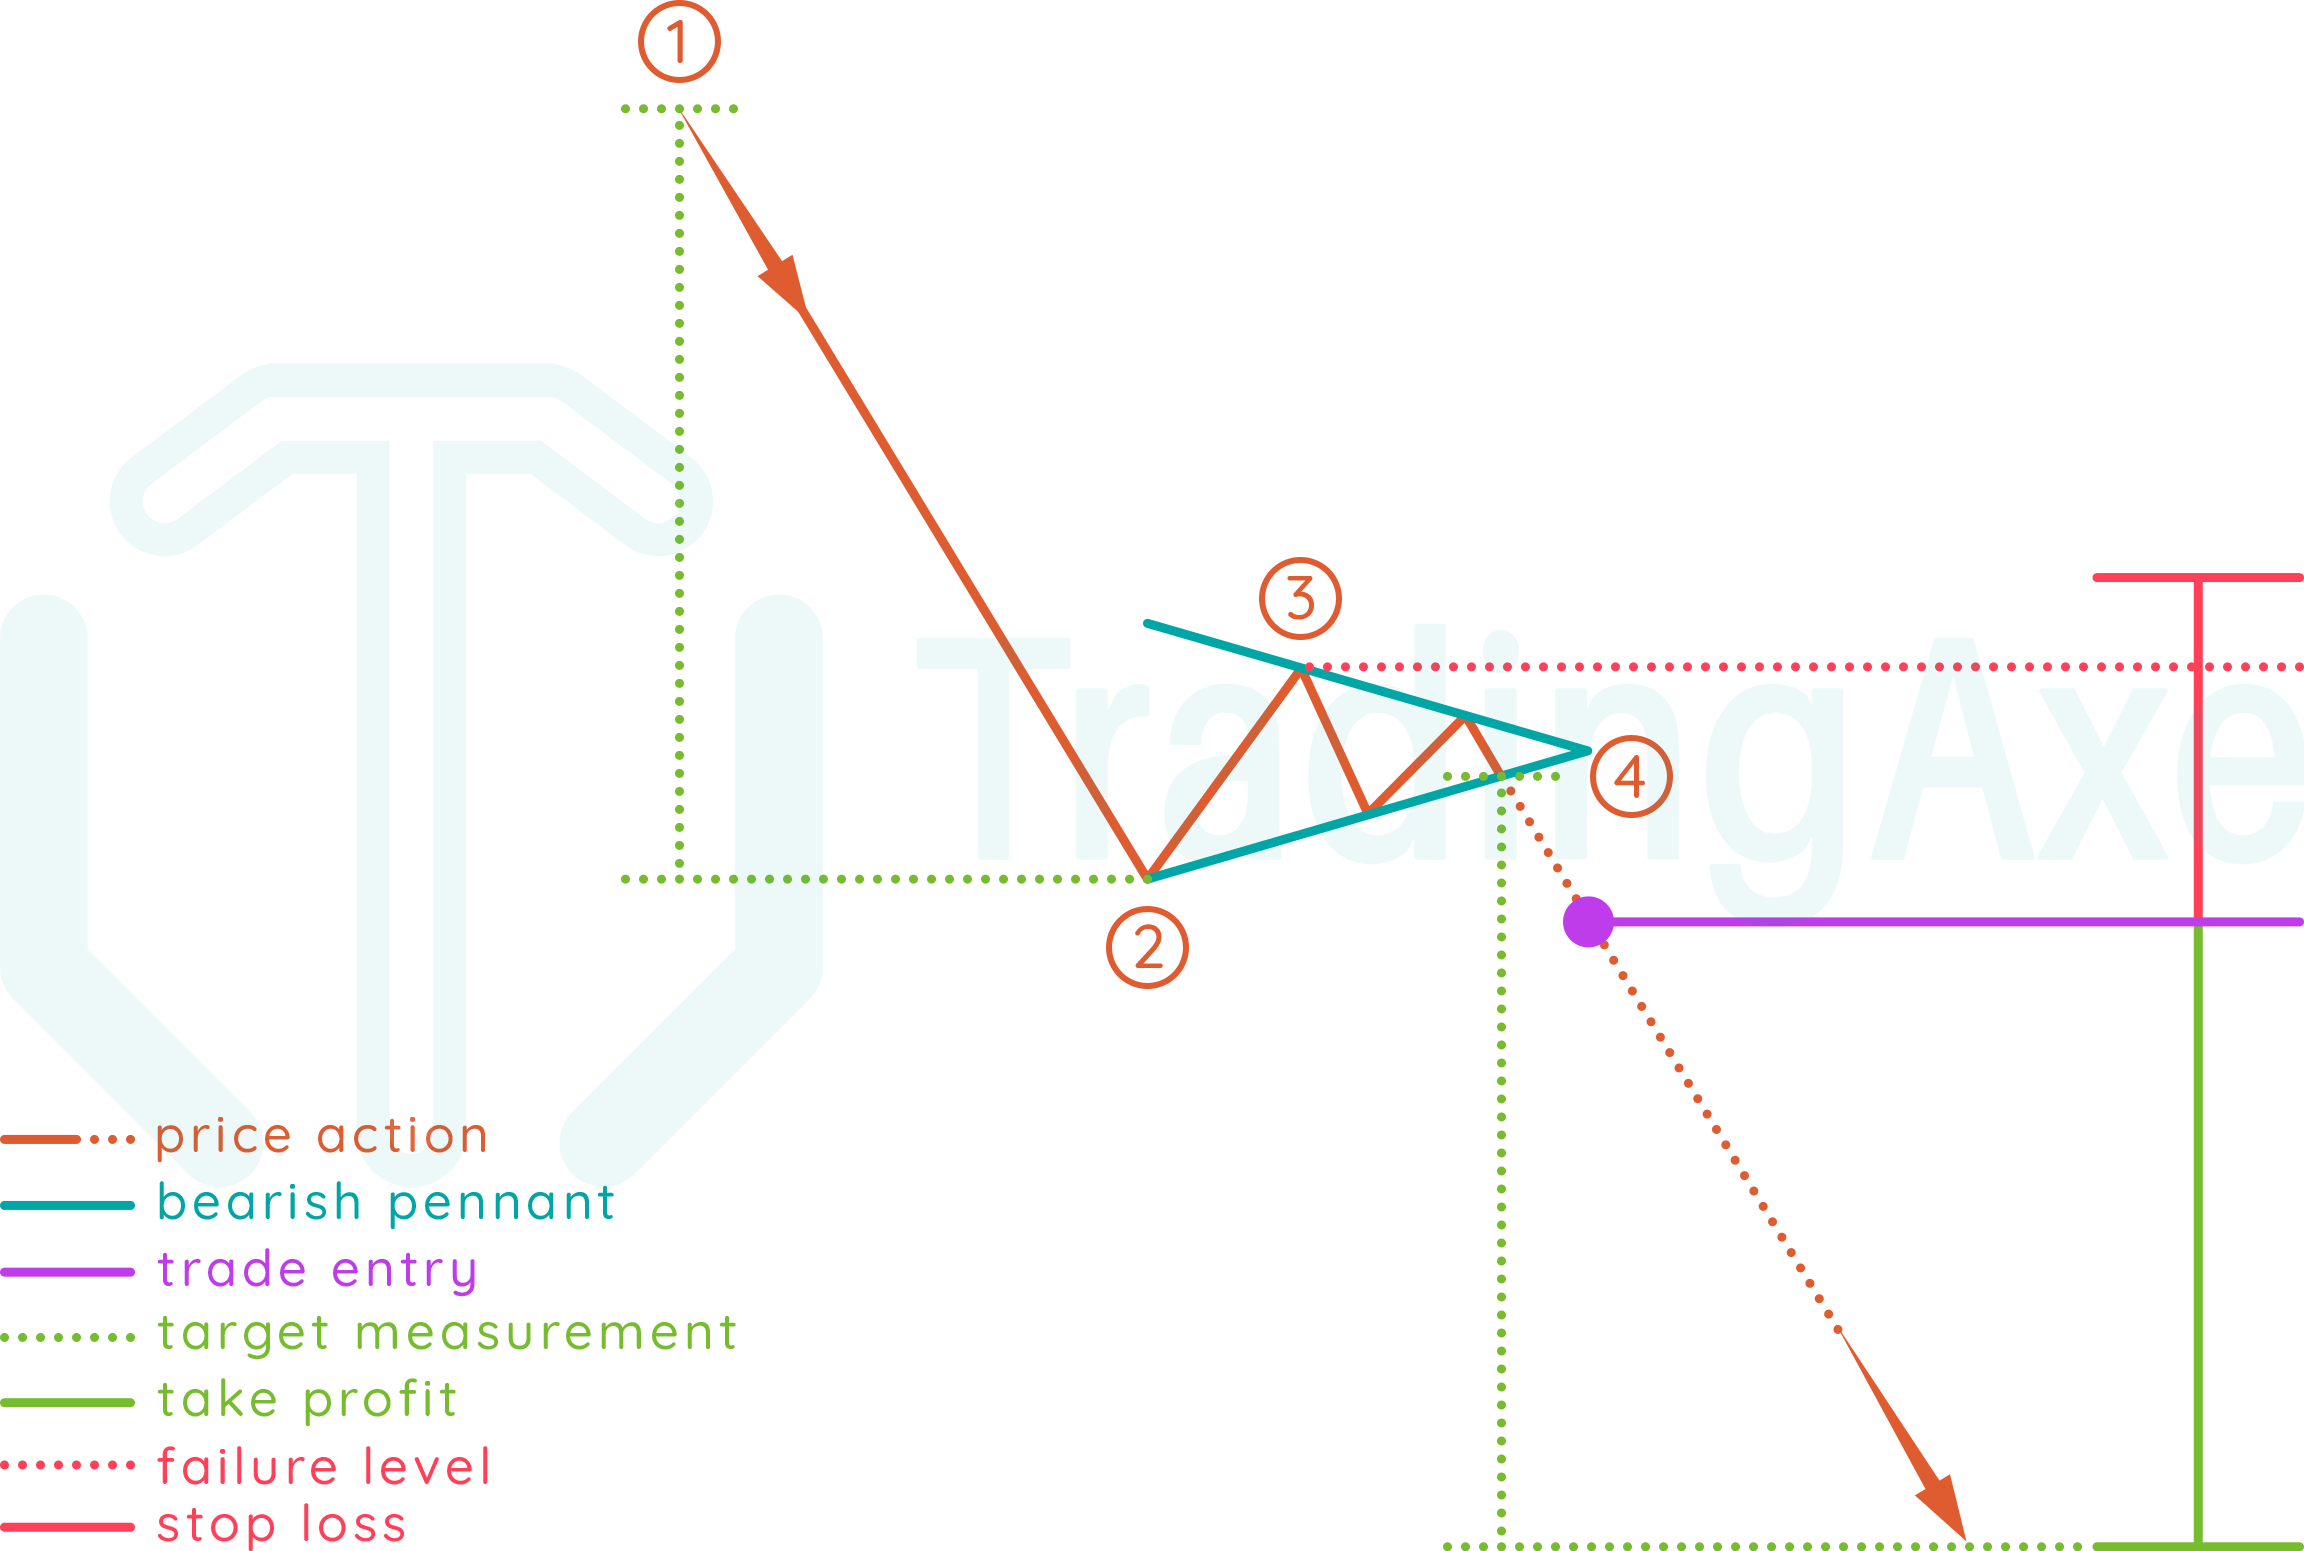
Entry: after breaking the pennant's lower border at point (4)

Take profit: identified by measuring the pennant's pole height, which is the vertical distance between points (1) and (2), that measurement is then applied from the breakout rate (4)

Stop loss: the pennant's highest high (3)

BEARISH PENNANT PRICE ACTION

This chart pattern starts forming with bears already in control of the exchange rate's sharp downtrend. When bulls enter the market, trading is contained briefly in a -mini- symmetrical triangle shape. Bears then break that triangle's lower resistance, and the exchange rate continues its downtrend.

Let's break down the pattern formation!

A sharp downwards price action is initiated from (1) till it finds the first resistance (2), creating the pennant's pole.

Price action reverses direction from the first resistance (2) and goes upwards till it finds the first support (3)

Price action bounces in (2-3) range, creating higher low(s) and lower high(s).

The pattern is completed when price action reverses direction from the last touch to the pennant's upper border and goes downwards till it breaks the pennant's lower border at point (4)

NOTES ON BEARISH PENNANT

Direction

Continuation

Type

Bearish

Occurrence

High

Common term

Short-Medium

Before the breakout, at least two lows (including the pennant's pole low) and two highs are the minimum for a valid pattern, more touches are acceptable.

The pennant's pole is a sharp downwards price action.

Volume is usually high at the pennant's pole, as well as when breaking the pennant's lower border.

This pattern is commonly found on short-term and medium-term time frames.

BEARISH PENNANT REWARD:RISK

This pattern is known for its high R:R.

R:R depends on the highest high to breakout distance (3-4), compared to the pennant's pole height (1-2)

Always remember that the stop loss level explained above is absolute, the actual stop loss rate for your trade setup should be a bit beyond those levels to give the trade setup some room to breathe, and of course, calculations for position size and R:R should be done with respect to that rate.

BEARISH PENNANT REAL TRADE

Forex chart of bearish pennant real trade
Forex chart of bearish pennant real trade, as found on the H4 chart of GBP/USD using FXCM's MT4 platform

PRE-BREAKOUT CALCULATIONS

Since a bearish pennant chart pattern can be spotted after the reversal from point (3), you can save yourself precious time by doing the following set of calculations before the breakout, since they don't rely on the trade's entry rate.

  • Pattern length (point (1) rate - point (2) rate)
    • (1.31433 - 1.29190) * 10000 = 224.3 pips
  • Stop loss rate (point (3) rate + 10% of pattern length)
    • 1.29726 + ((10 * 224.3 / 100) / 10000) = 1.29950

POST-BREAKOUT CALCULATIONS

Take profit calculation depends on the pennant's lower border breakout rate, which is the variable point (4). It is highly recommended to calculate it as soon as a breakout occurs, so you can focus more on the calculations needed for the actual trade.

  • Take profit rate (breakout rate - pattern length)
    • 1.29239 - (224.3 / 10000) = 1.26996

TRADE SETUP

Choosing when to enter the trade after the pennant's lower border breakout is always left to your best judgement. In this trade, we chose to enter the market at the closing rate of the candle that broke the pennant's lower border, which was a strong bearish candle that closed on a lower rate than that of the pennant's pole low (2), suggesting a real breakout for the pennant's lower border.

  • Trade entry rate
    • At the closing rate of the candle that broke the pennant's lower border at point (4): 1.29047
  • Take profit in pips (entry rate - take profit rate)
    • (1.29047 - 1.26996) * 10000 = 205.1 pips
  • Stop loss in pips (stop loss rate - entry rate)
    • (1.29950 - 1.29047) * 10000 = 90.3 pips
  • Stop loss R:R (take profit in pips / stop loss in pips)
    • 205.1 / 90.3 = 2.271

Currency pair

GBP/USD

Timeframe

H4

Breakout

8-Aug-2018

Platform

MT4

Broker

FXCM

Smaller forex chart of bearish pennant real trade