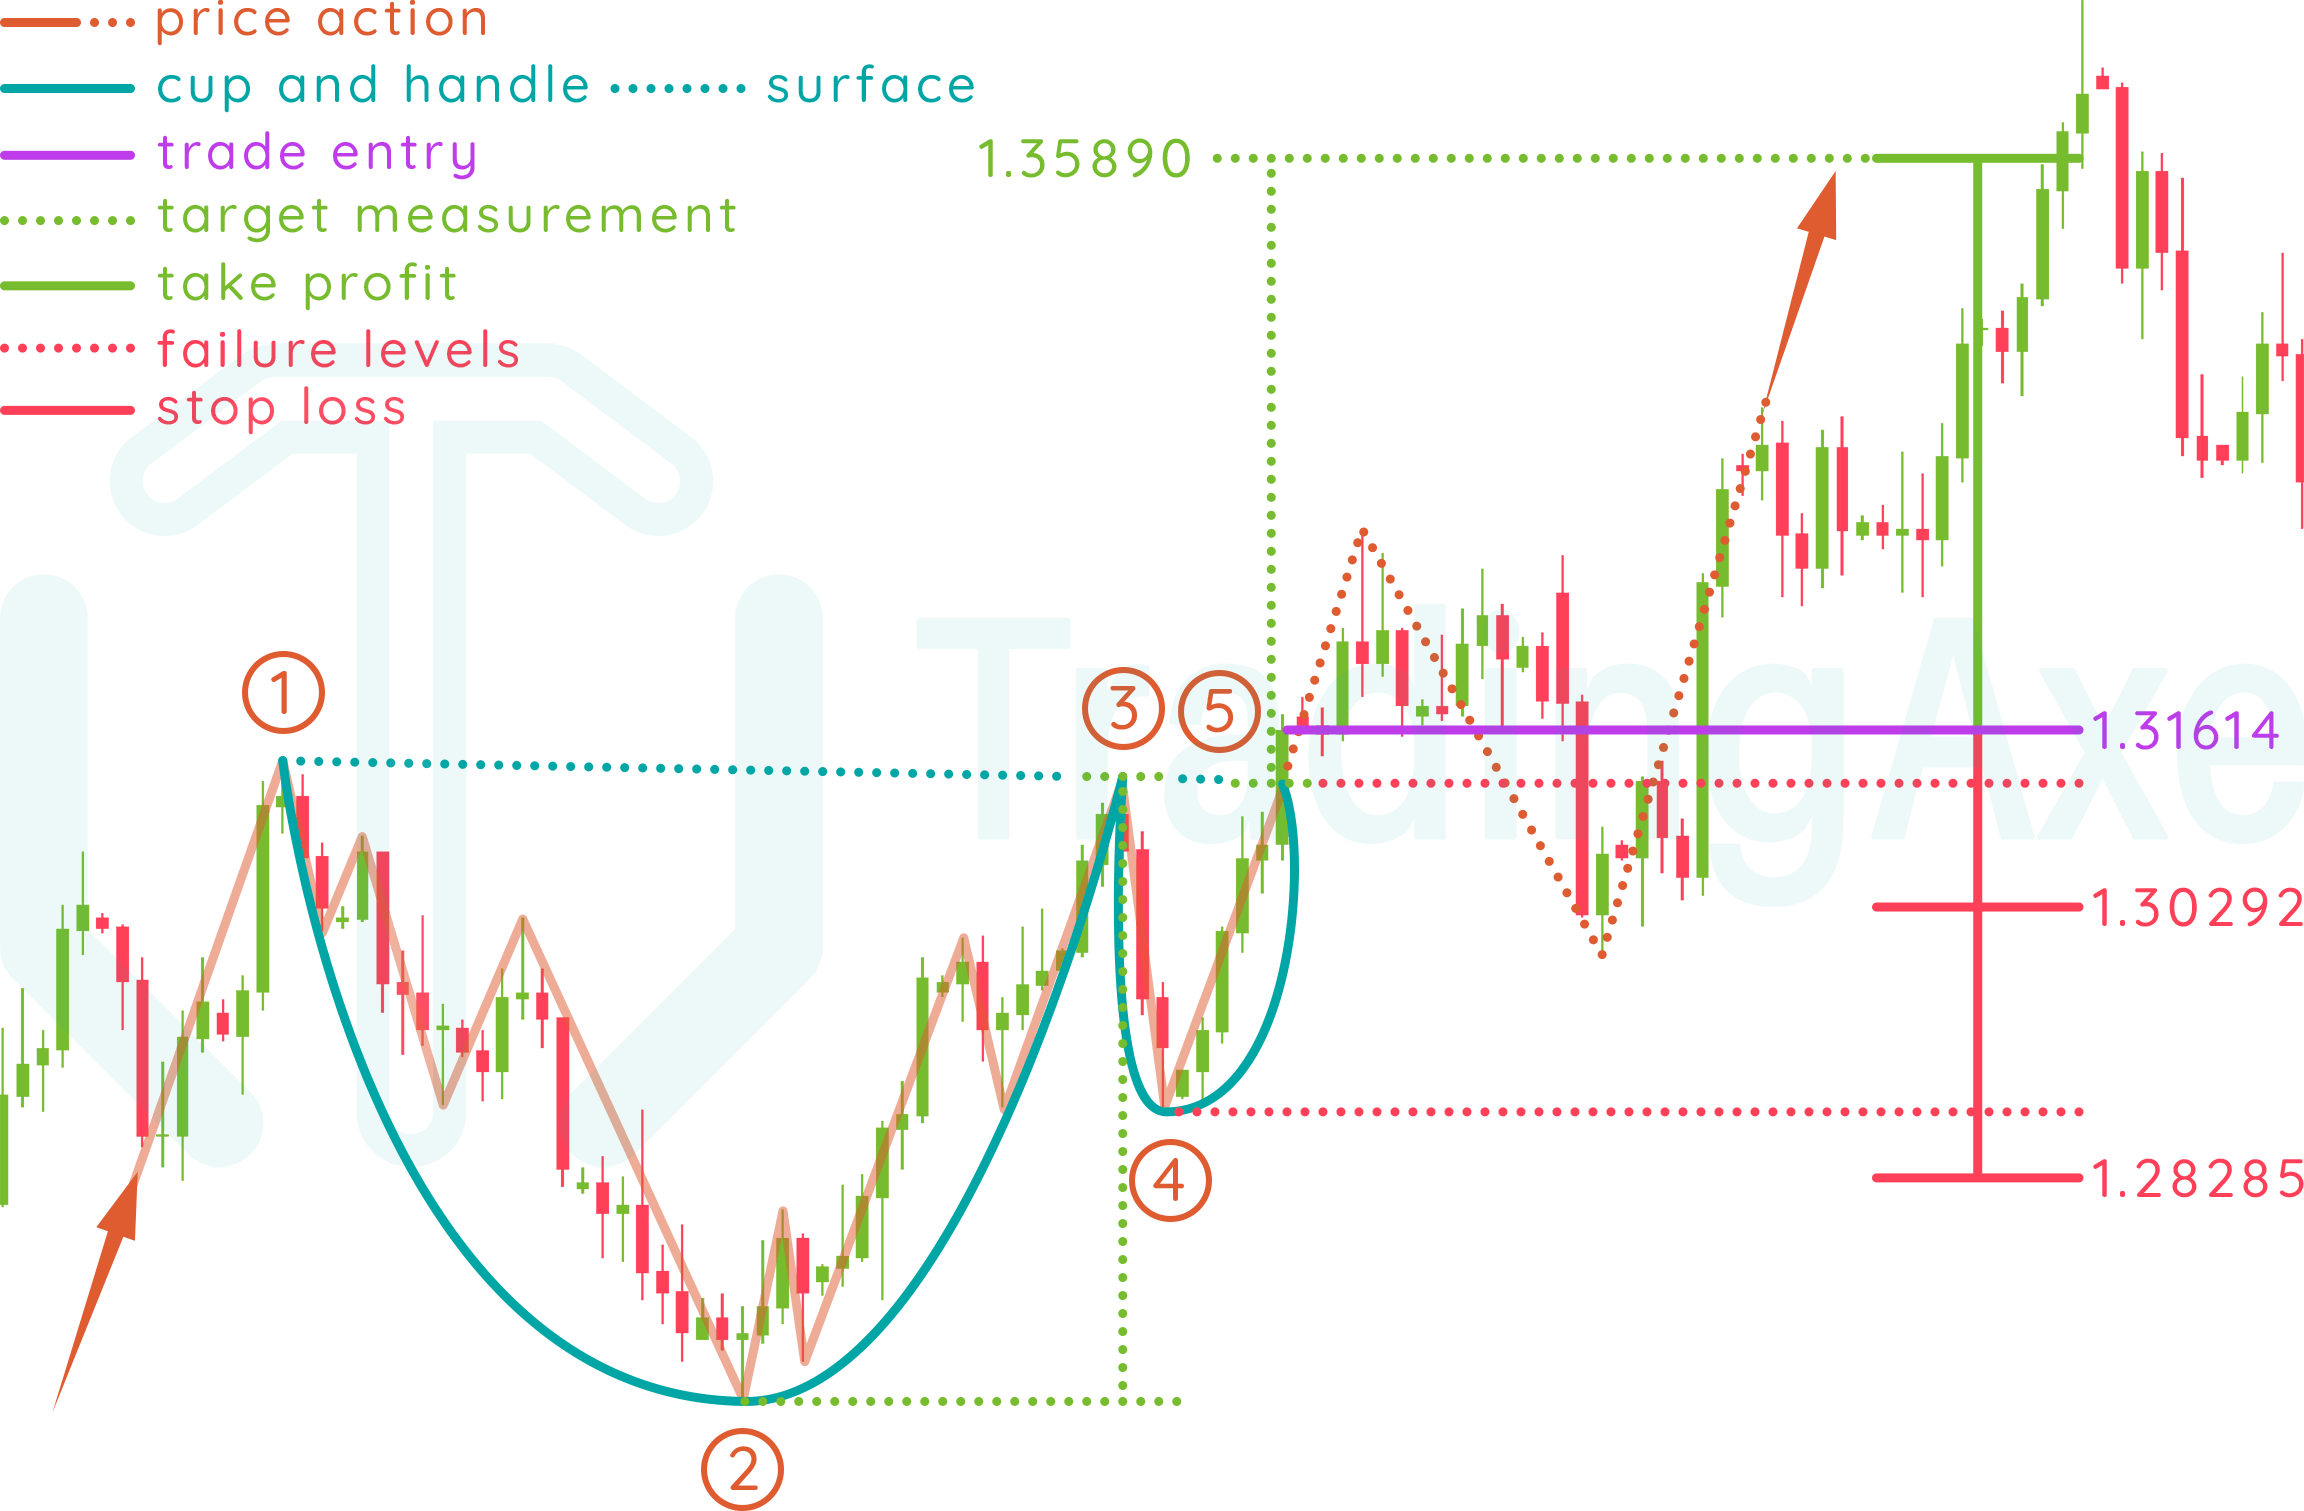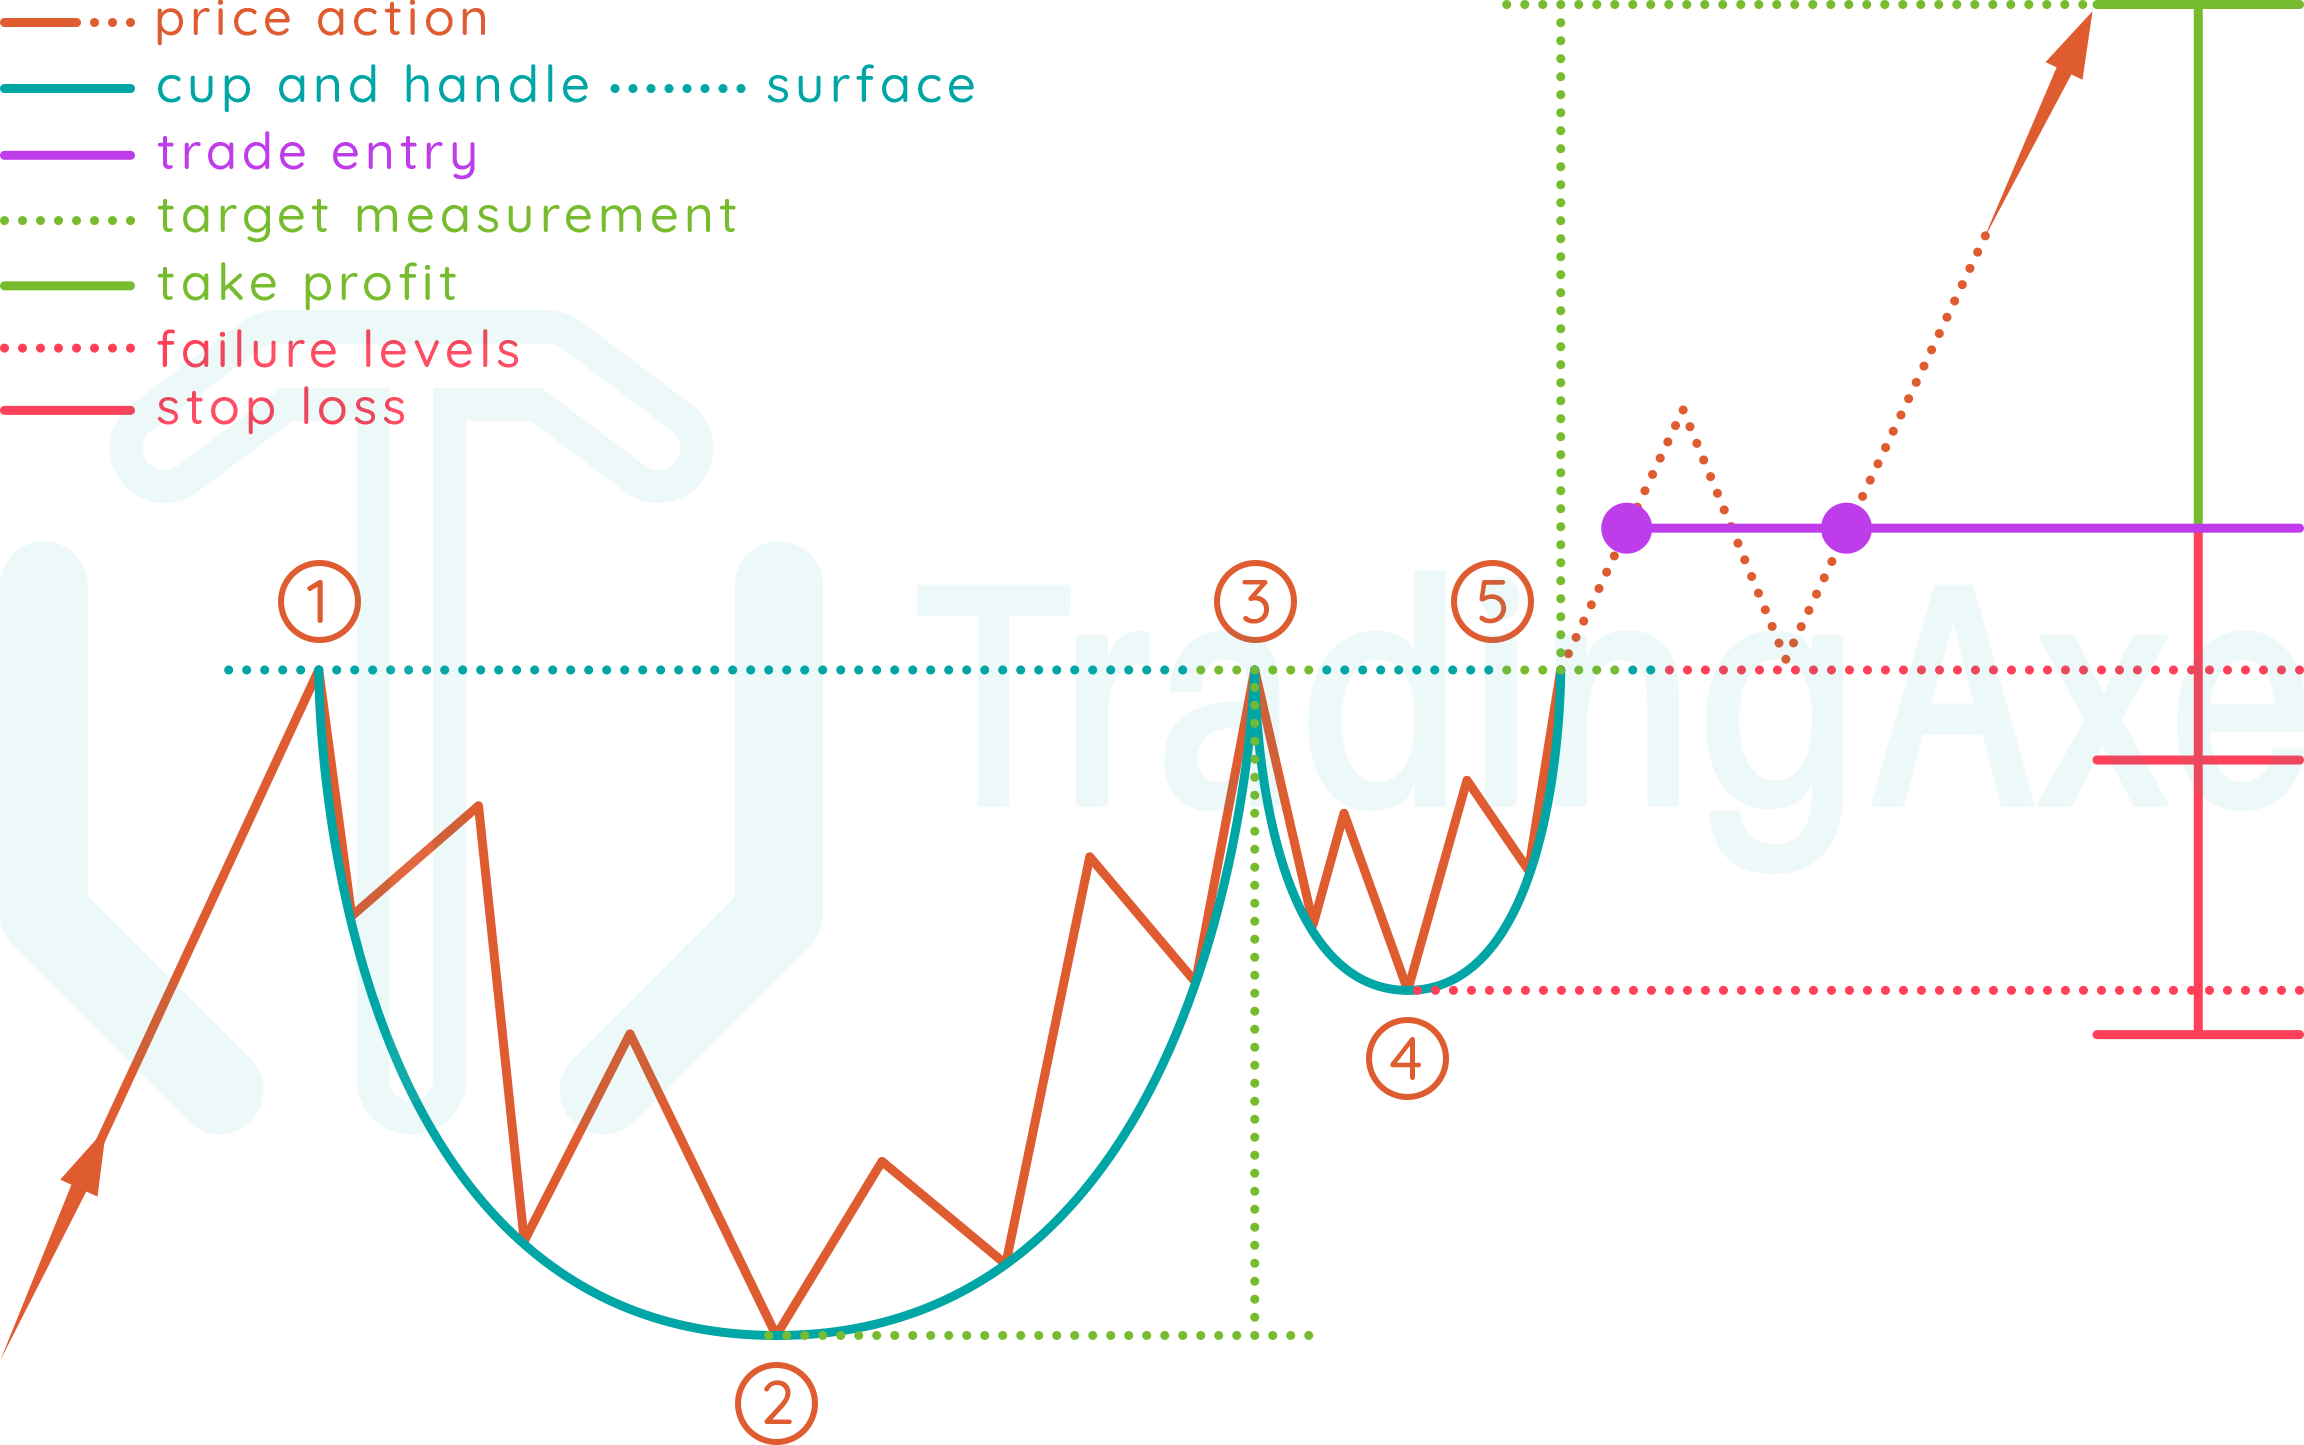
Entry: after breaking the surface at point (5), either with an entry after the breakout, or after a possible retest of the surface.
Take profit: identified by measuring the vertical distance from the the cup's low (2) to the cup's second resistance (3), that measurement is then applied from the breakout rate (5)
Stop loss: can either be the surface breakout rate (5), or the handle's low (4)
CUP AND HANDLE PRICE ACTION
This chart pattern starts forming with bulls already in control of the exchange rate's uptrend. As bears enter the market, they slowly and steadily squeeze on bulls, till the bulls reverse direction and push the rate upwards in the same slow and steady manner. The same squeeze and reversal is then repeated in a narrower range and shorter time period, till the bulls finally break the cup and handle's surface created by the bears, and the exchange rate continues its uptrend.
Let's break down the pattern formation!
In an uptrend, price action finds the first resistance (1)
Price action reverses direction and goes downwards slowly and steadily till it finds the first support (2), which will be the lowest low in the pattern.
Price action reverses direction from the first support (2) and goes upwards slowly and steadily, till it finds the second resistance (3), completing the cup formation.
Price action reverses direction from the second resistance (3) and goes downwards, till it finds the second support (4), which must be higher than the first support (2)
The pattern is completed when price action reverses direction from the second support (4) and goes upwards till it breaks the cup and handle's surface at point (5)
NOTES ON CUP AND HANDLE
Direction
Continuation
Type
Bullish
Occurrence
Low
Common term
Medium-Long
The cup and handle surface is identified by drawing a trend line connecting both resistances of the cup formation (1-3)
Handle formation might be shaped as a down-sloped flag facing away from the surface.
Cup and handle's surface can be skewed.
Volume usually decreases as the pattern is being formed, and increases when breaking the surface or retesting the breakout rate.
This pattern is commonly found on medium-term and long-term time frames.
CUP AND HANDLE REWARD:RISK
When using the surface's breakout rate as stop loss, R:R will depend on the (breakout rate-entry rate) distance, compared to the cup's height (2-3)
When using the handle's low (4) as stop loss, the pattern's R:R improves when the handle's height (4-5) is relatively short compared to the cup's height (2-3)
Always remember that both stop loss levels explained above are absolute, the actual stop loss rate for your trade setup should be a bit beyond those levels to give the trade setup some room to breathe, and of course, calculations for position size and R:R should be done with respect to those rates.