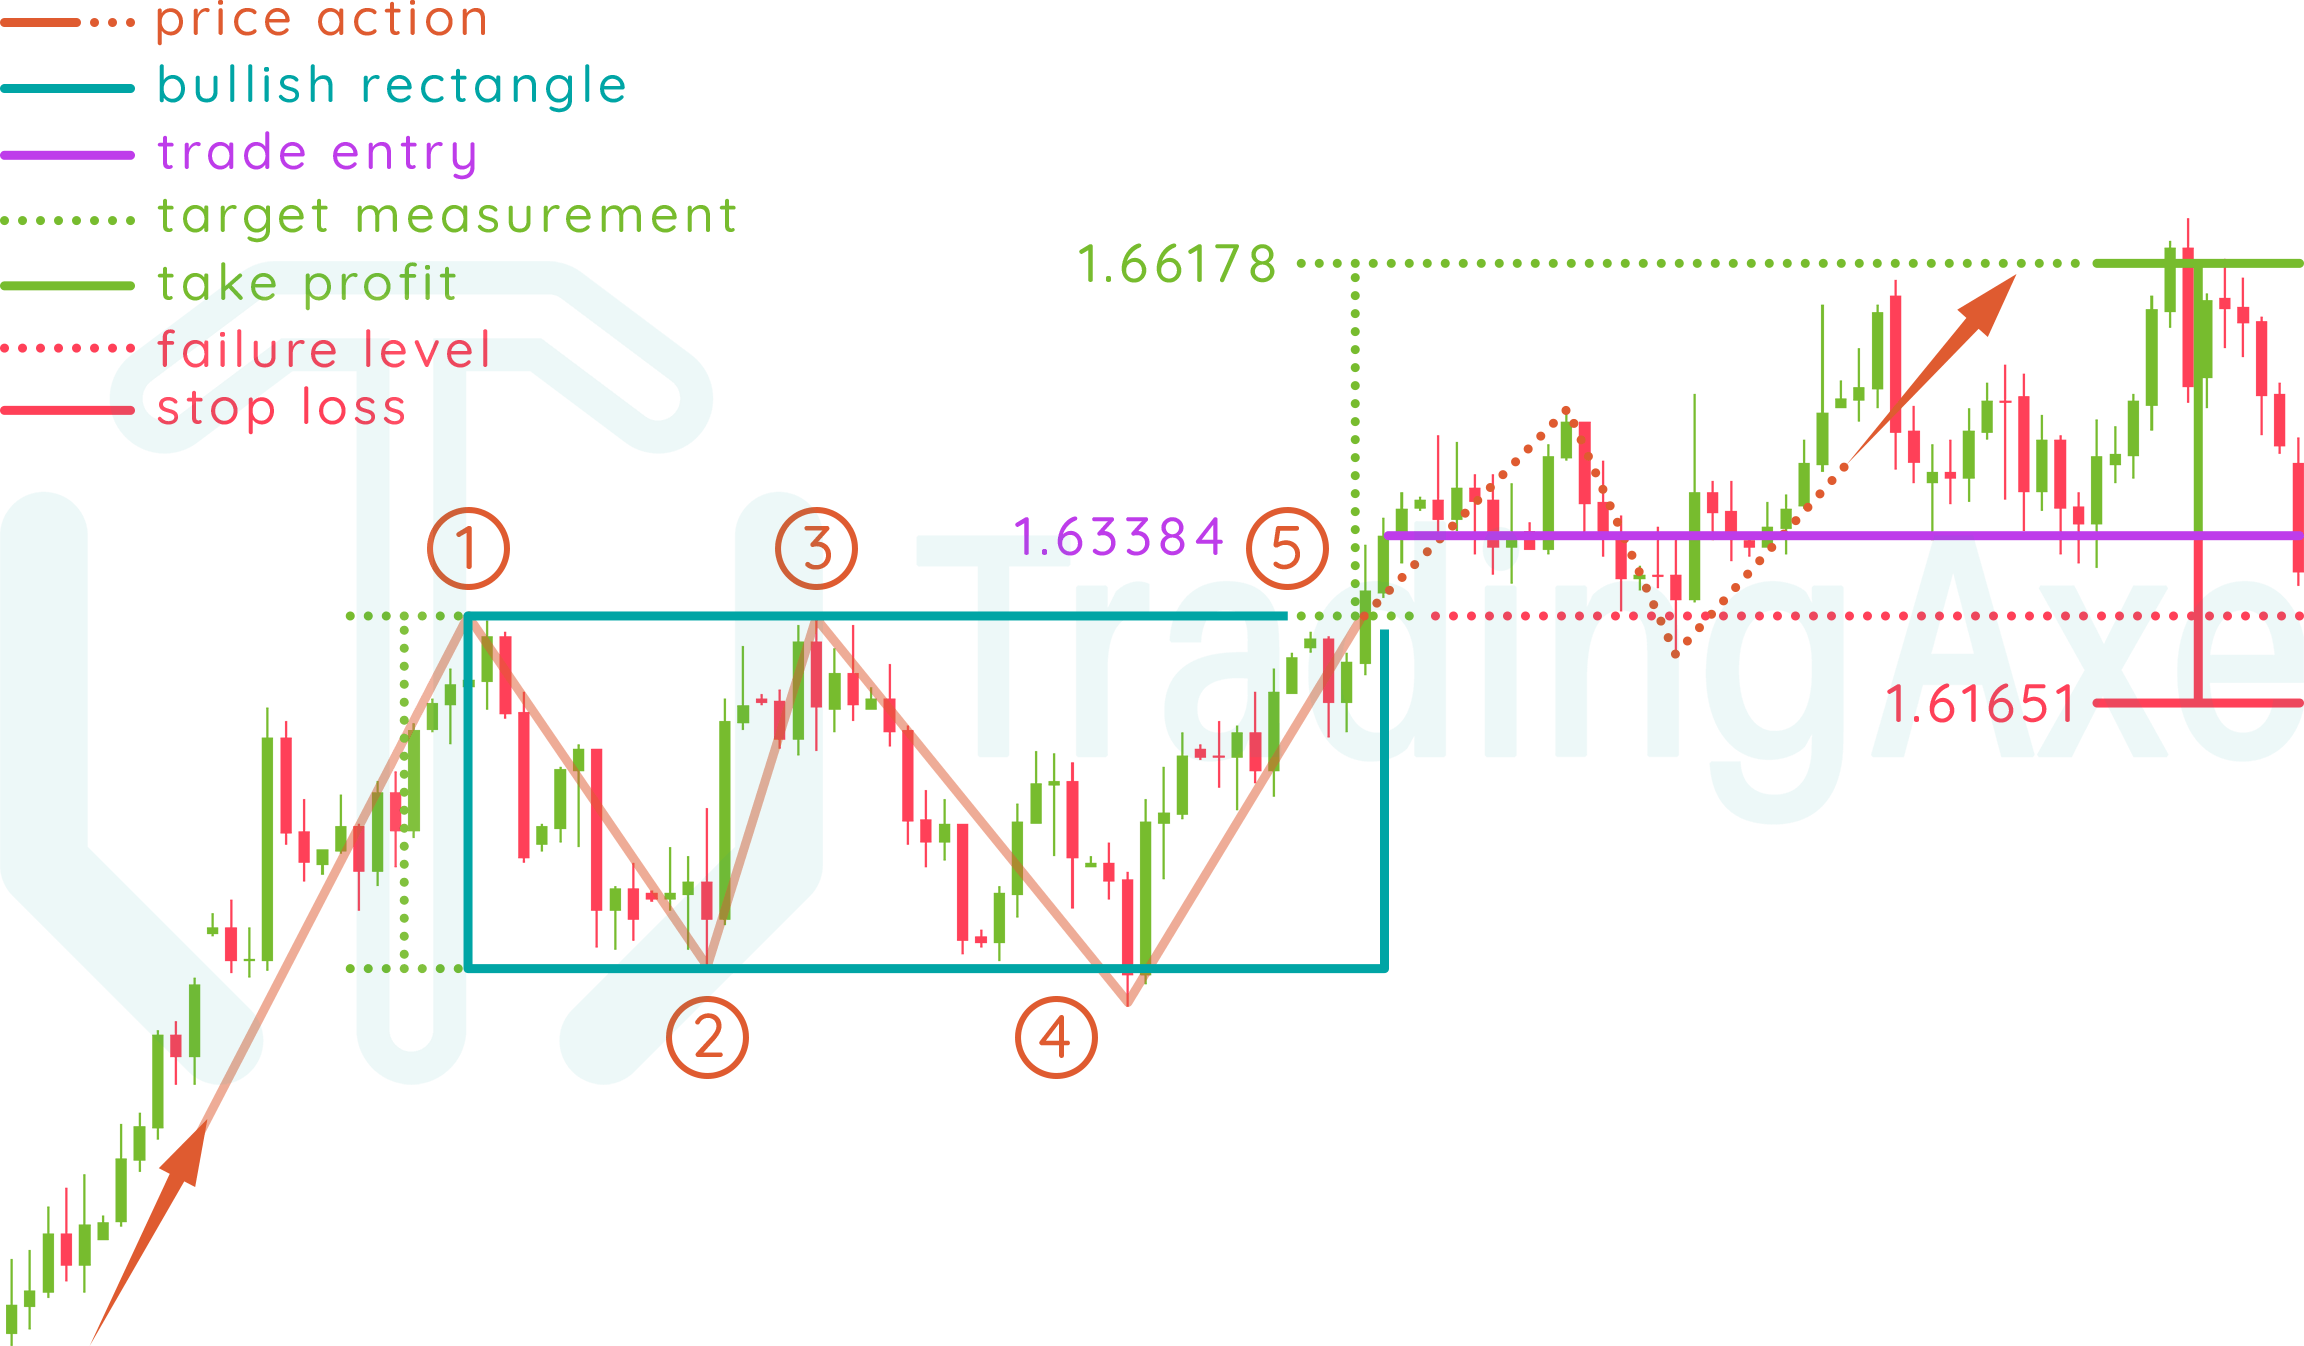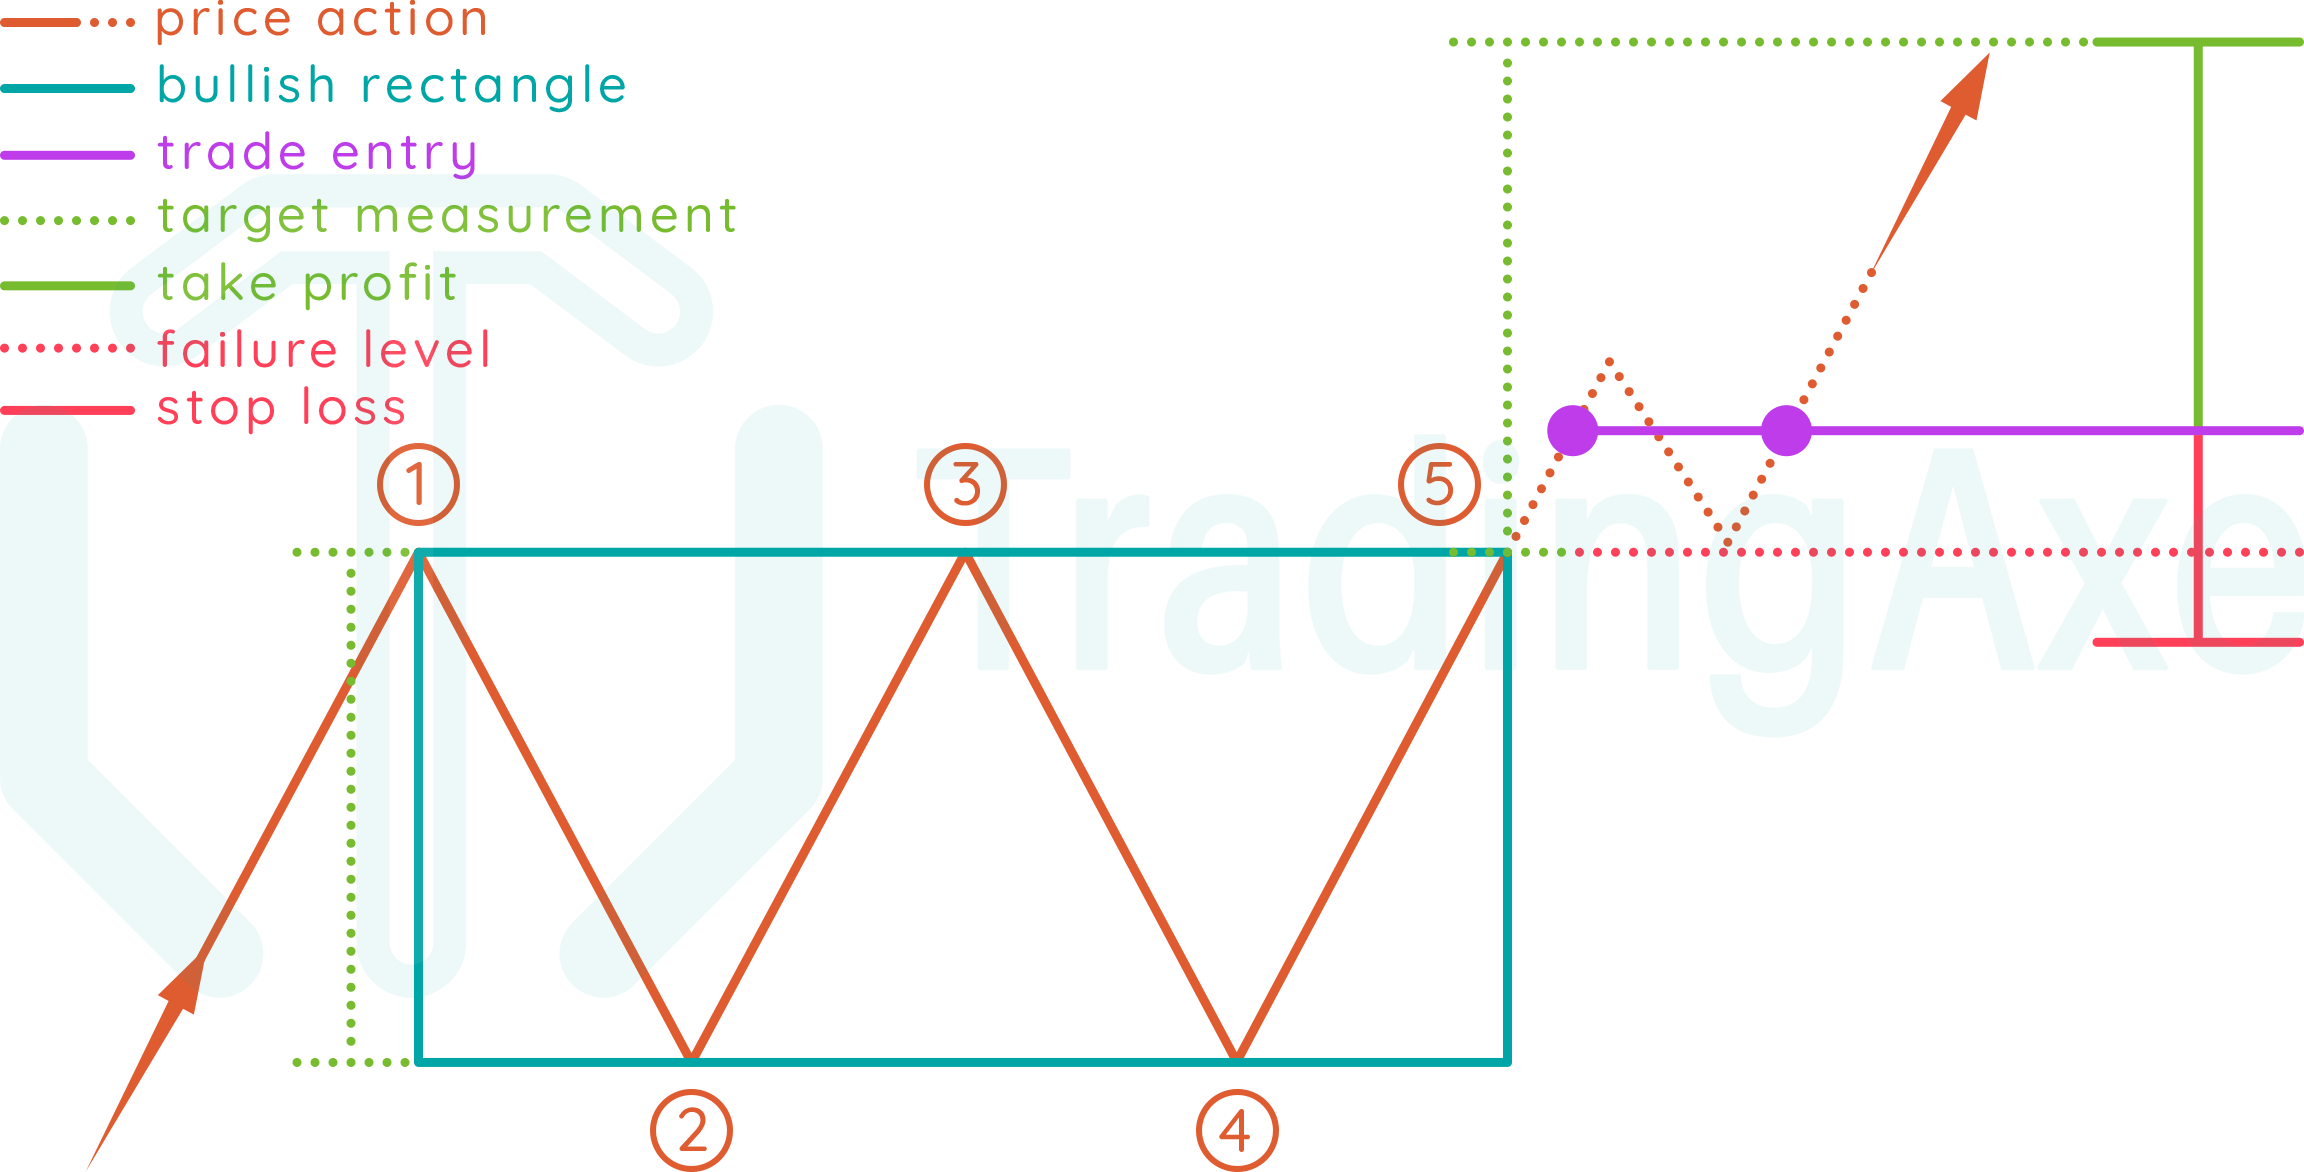
Entry: after breaking the rectangle's upper border at point (5), either with an entry after the breakout, or after a possible retest of the upper border.
Take profit: identified by measuring the vertical distance between the rectangle's upper and lower borders, that measurement is then applied from the breakout rate (5)
Stop loss: the rectangle's upper border, which is a resistance that turned into support after the breakout.
BULLISH RECTANGLE PRICE ACTION
This chart pattern starts forming with bulls already in control of the exchange rate's uptrend. When bears enter the market, a consolidation period starts and rate gets contained within a specific range, where bears are creating a resistance at a certain rate, and bulls are creating support at a certain rate as well. Bulls then break that consolidation, and the exchange rate continues its uptrend.
Let's break down the pattern formation!
In an uptrend, price action finds the first resistance (1), which will be the horizontal resistance for the rest of the pattern formation.
Price action reverses direction from the first resistance (1) and goes downwards till it finds the first support (2), which will be the horizontal support for the rest of the pattern formation.
Price action reverses direction from the first support (2) and goes upwards, till it finds the second resistance (3), which will be around the same rate of the first resistance (1)
Price action reverses direction from the second resistance (3) and goes downwards, till it finds the second support (4), which will be around the same rate of the first support (2)
The pattern is completed when price action reverses direction from the second support (4) and goes upwards till it breaks the rectangle's upper border at point (5)
NOTES ON BULLISH RECTANGLE
Direction
Continuation
Type
Bullish
Occurrence
High
Common term
All
Before the breakout, 4 touches to the rectangle's upper and lower borders are the minimum for a valid pattern, more touches are acceptable.
After the breakout, retesting the rectangle's upper border, which was a resistance that turned to support, is highly possible.
The most common direction of the pattern is a continuation, but that doesn't rule out the existence of reversal rectangles. The target measurement in that case will be applied from the lower border's breakout rate.
Volume usually increases when breaking or retesting the rectangle's upper border (5)
This pattern is commonly found on all time frames.
BULLISH RECTANGLE REWARD:RISK
R:R depends on the (upper border-entry rate) distance, compared to (upper border-lower border) distance.
Always remember that the stop loss level explained above is absolute, the actual stop loss rate for your trade setup should be a bit beyond those levels to give the trade setup some room to breathe, and of course, calculations for position size and R:R should be done with respect to that rate.