What is a chart pattern?
In a nutshell, a chart pattern is a geometric representation of buyers (bulls) and sellers (bears) trading an asset in a certain way, till one group gains control over the asset's direction.
Okay, that was not helpful, at all!
Let's take it one step at a time, it will make more sense if we illustrated the formation stages of a chart pattern.
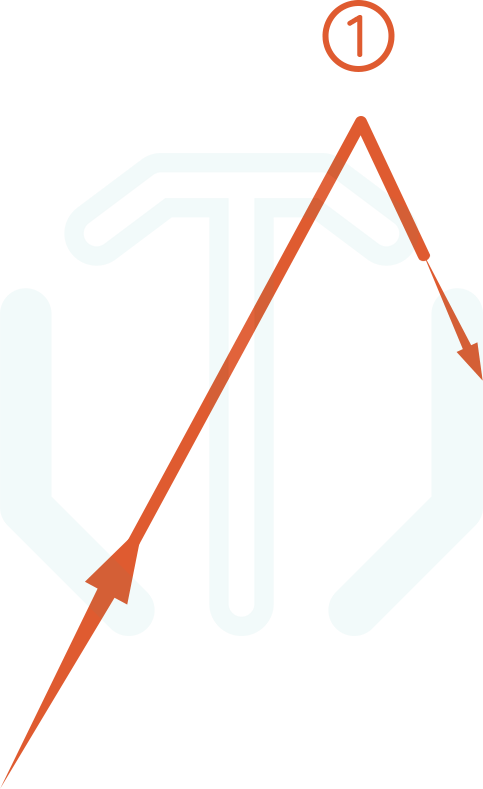
Here, buyers were in control and price was going up. Sellers stepped in and were able to reverse the direction of the price downwards. The reversal of direction is a point of significance, thus we will mark this as point (1).
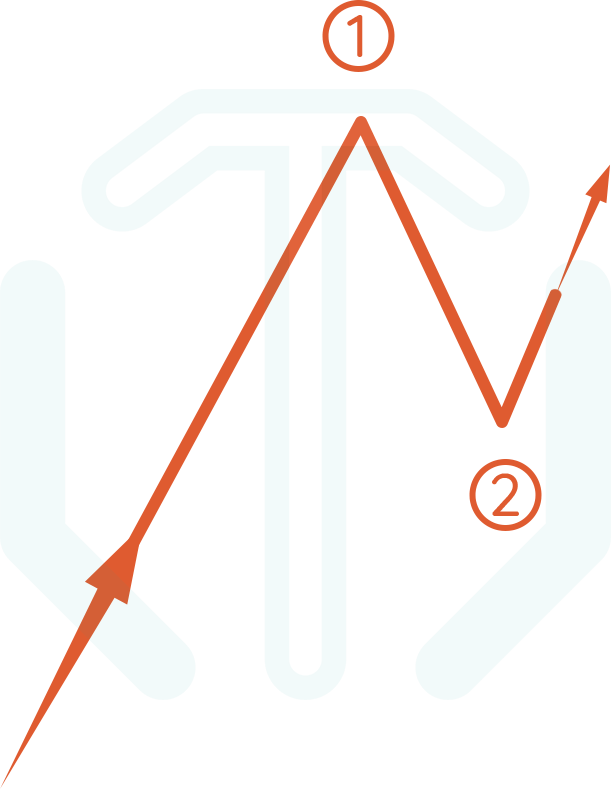
As the price goes down, buyers stepped in and were able to reverse the direction to their favour. Creating a point of significance that we will mark as point (2).
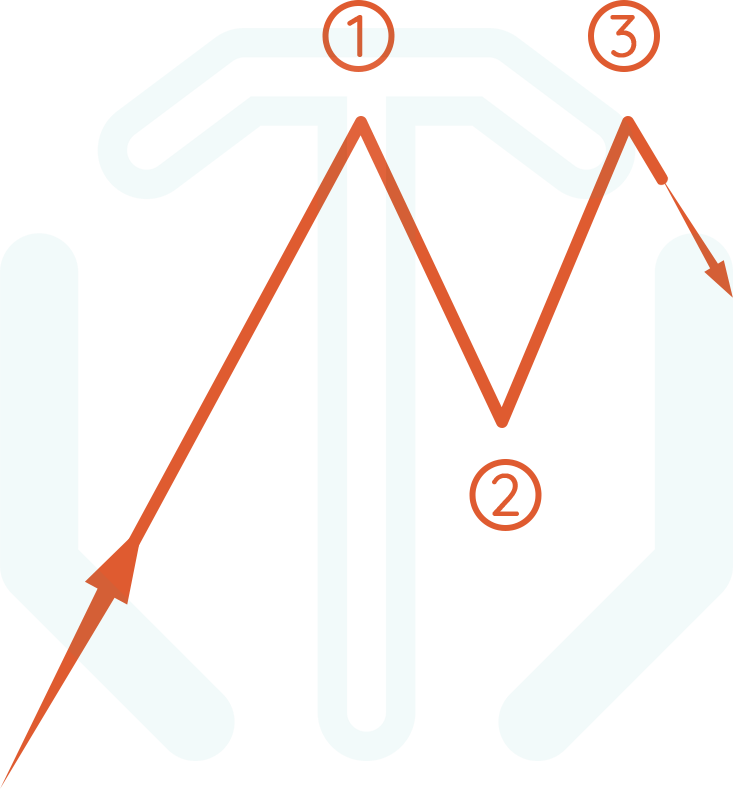
As the price goes upwards, reaching the same price where the sellers made their first move, they stepped in again and reversed the direction downwards. We will call this point of significance (3).
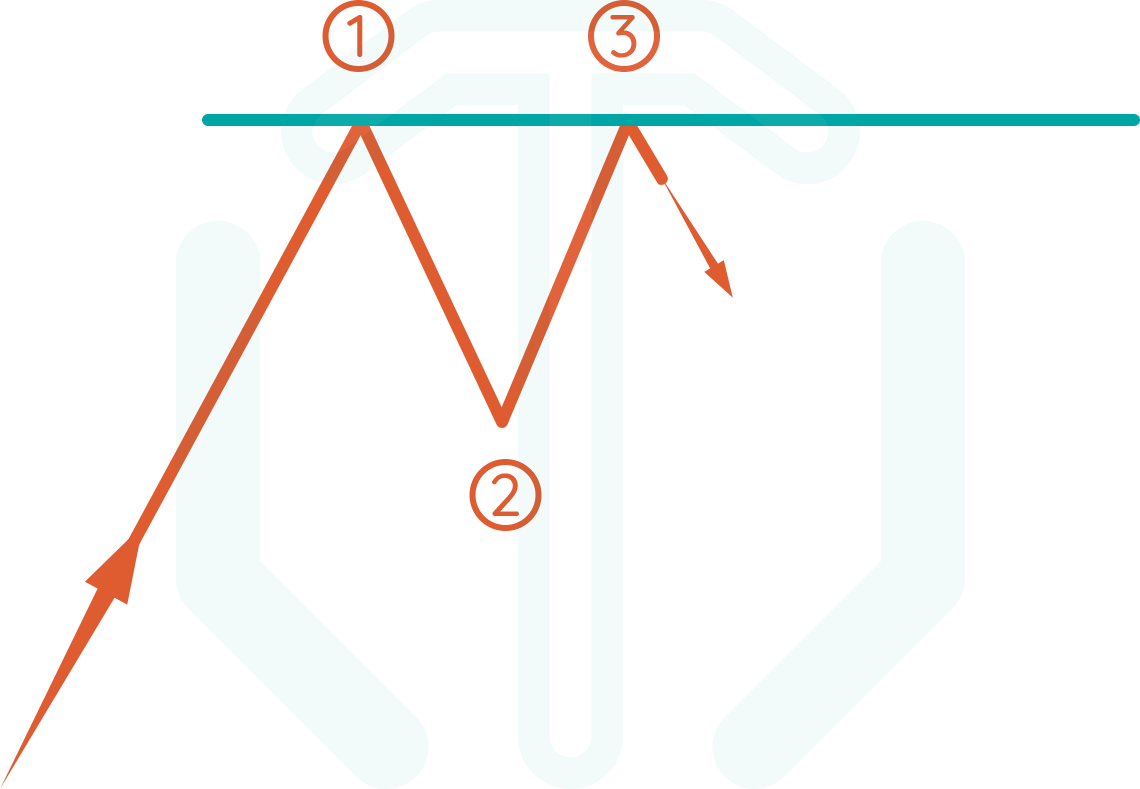
Now that the sellers successfully reversed the direction twice, why don't we create a trend line to represent what they are doing? We do so by creating a line that goes through points (1) and (3).
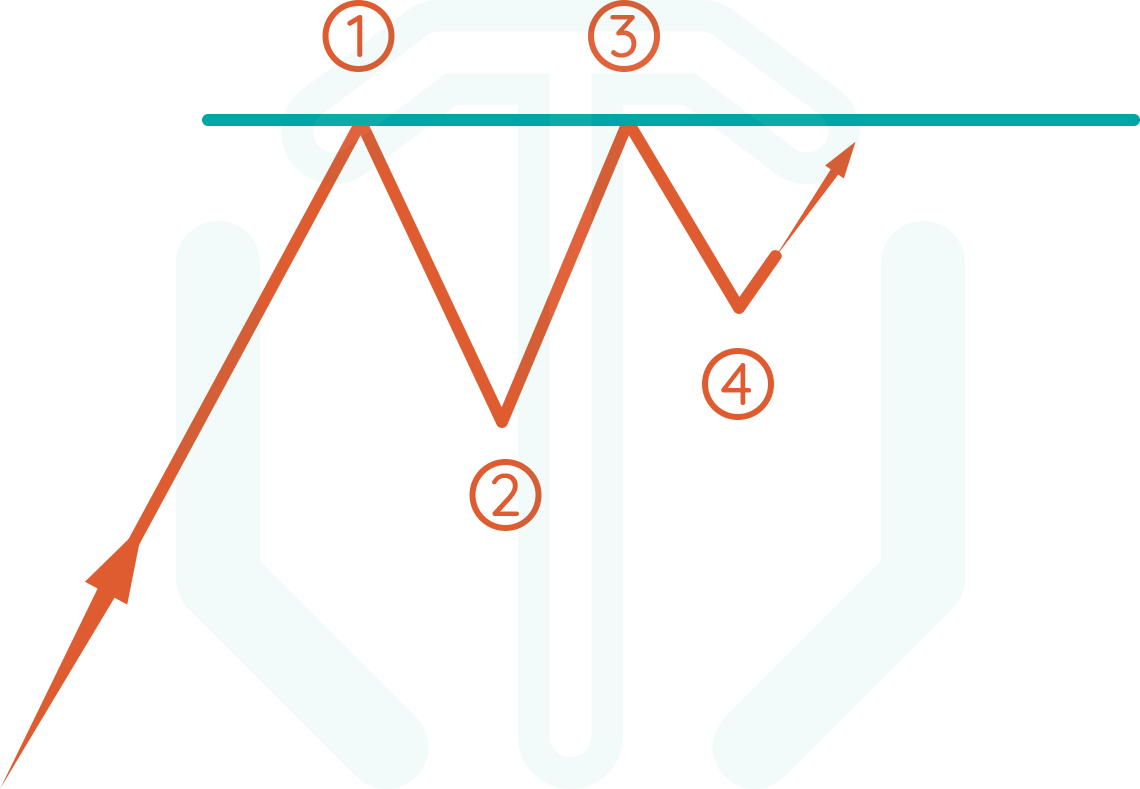
Once again, buyers decided to step in and reverse the direction again, in a price even higher than their first action marked by point (1). We will call this point of significance (4).
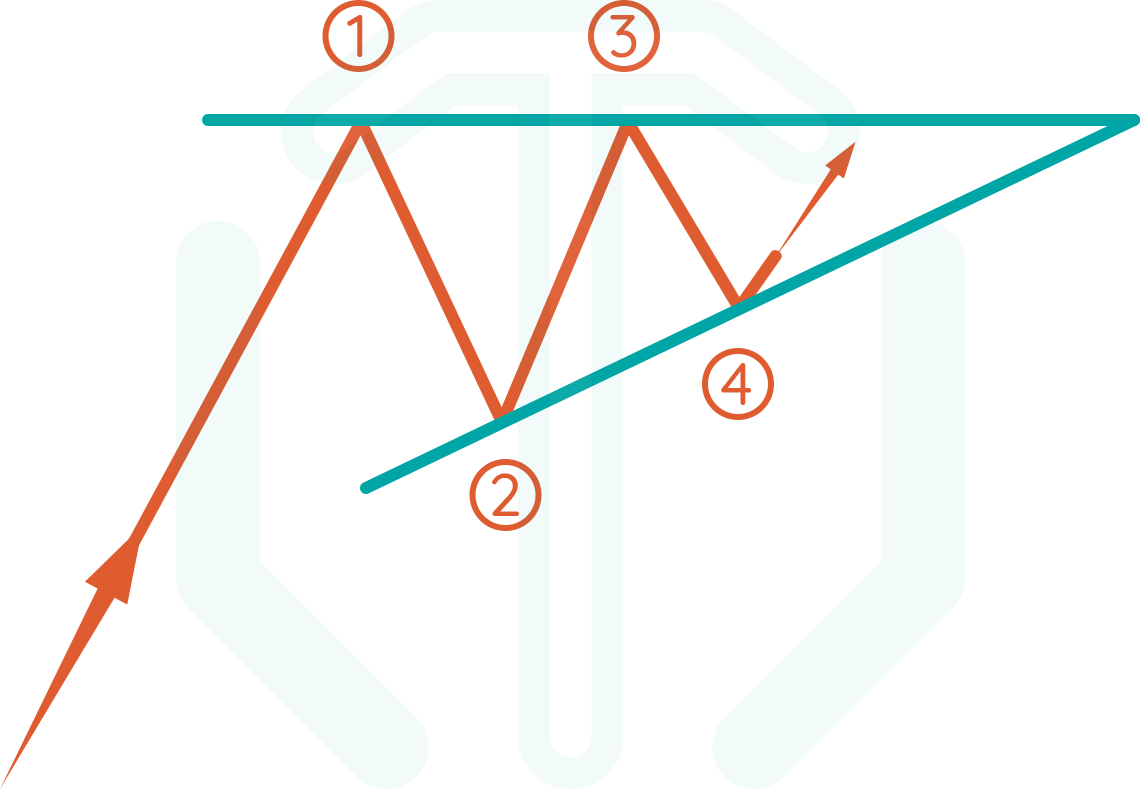
Wouldn't it be fair for buyers that we create a trend line just like we did for the sellers? Let's do this by extending a line that goes through points (2) and (4).
As you might have already noticed, the trend lines we created forms a geometric shape, that resembles an ascending triangle, nice!
Okay, so let's pause here and think about what is going on.
Points (1) and (3) show that the sellers are creating a resistance because they believe the price won't go any higher than that. While on the other hand, buyers are becoming more aggressive and closing in on the price held by the sellers.
At this point, a chart pattern is formed and you are about to take a trading decision.
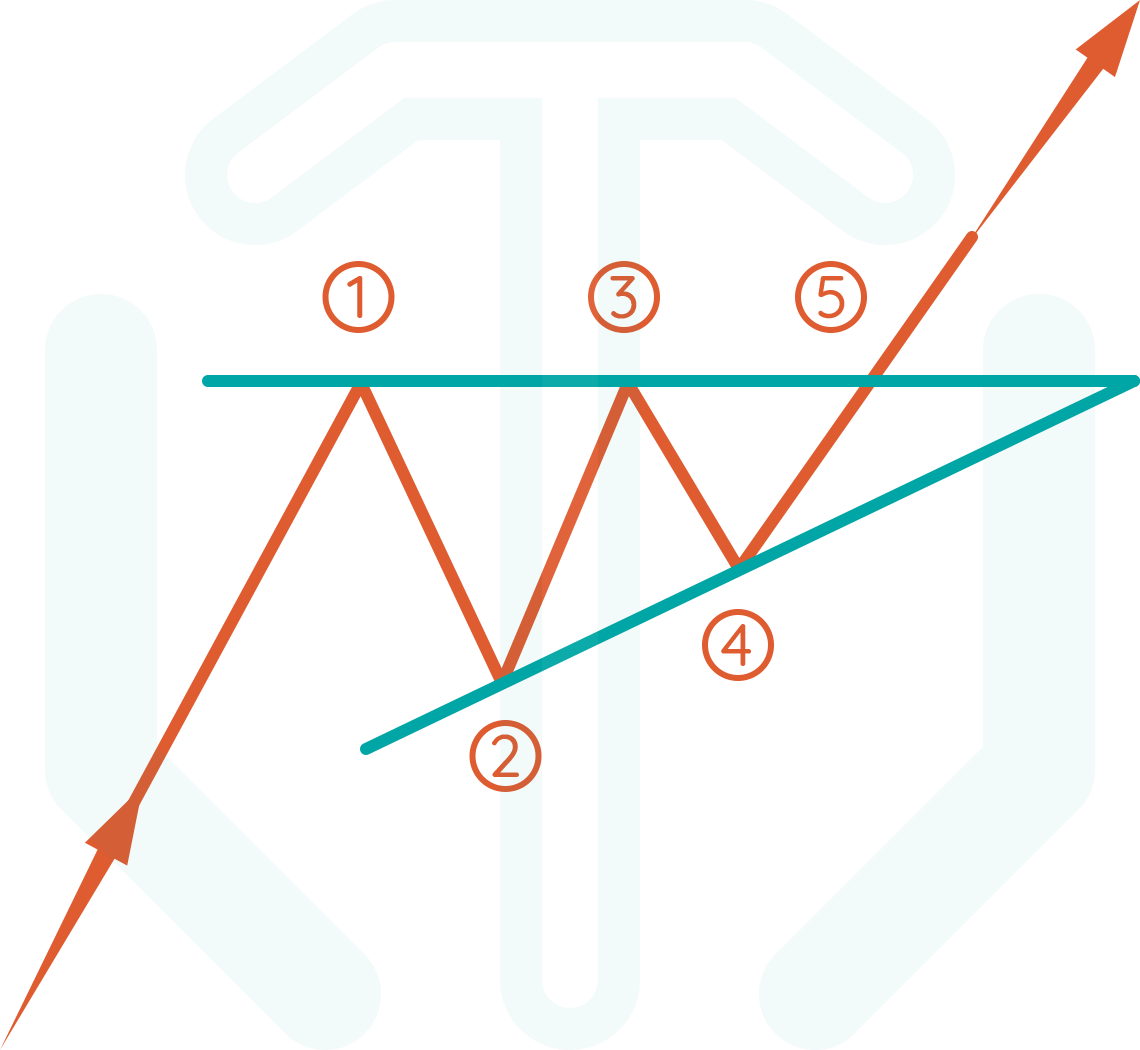
Logically speaking, if the price continued going up and broke the trend line created by sellers, that means the buyers won this and most likely price will continue going up and your trading decision should be a buy.
But many questions immediately pop up!
When should you buy?
Where to put your stop loss order?
Where to put your take profit order?
These are the type of questions that are answered by studying the different chart patterns. A chart pattern tells you what to expect when it is formed, it helps you take a trade based on a specific set of rules that proved profitable over time.
Amazing! So this guarantees profitable trades?
NO, definitely not!
Chart patterns are "more likely" to do what you expect them to do. They never guarantee you a profitable trade. In a matter of fact, in trading, nothing ever guarantees you a profitable trade.
They are expected to give you profit over time. If they are more likely to end up in your favour, then after trading them for some time, the profitable ones are expected to generate more money than the money lost in failed trades.
Okay, how many chart patterns are there?
In short, 20 patterns. But since they come in pairs, you only have to study 10 patterns and each of the remaining 10 will have the same exact rules of their pair, just inverted.
You don't have to study all of them at once. Focusing on one or two of the more popular patterns is a good way to start familiarizing yourself with trading chart patterns.
What about the patterns' names, is there a "pattern" for that?
Ironically, there is no consistent naming pattern of the patterns, pun intended!
Some pairs of patterns have "inverted" prefixing the opposite pattern.
- head and shoulders VS inverted head and shoulders
- cup and handle VS inverted cup and handle
Others have the same name, so we just prefix them by their direction.
- bullish flag VS bearish flag
- bullish pennant VS bearish pennant
- bullish rectangle VS bearish rectangle
- bullish symmetrical triangle VS bearish symmetrical triangle
Then, the double and triple family.
- double top VS double bottom
- triple top VS triple bottom
Finally, those who have their pairs named individually.
- rising wedge VS falling wedge
- ascending triangle VS descending triangle
But, why didn't they just name them all with their direction prefix and be consistent? Nobody knows! They can be a bit confusing in the beginning, but you will get used to them fast enough.
About the course
In order to make your learning process easier, we arranged the course in a specific way so you can choose exactly what you want to learn, let that be a single pattern, a family of patterns, or each single one of them.
- Introduction (this lesson)
- Introduction to chart patterns
- Triangle patterns (7 lessons)
- Ascending Triangle
- Descending Triangle
- Bullish Symmetrical Triangle
- Bearish Symmetrical Triangle
- Falling Wedge
- Rising Wedge
- How to differentiate triangle chart patterns
- Rectangle patterns (7 lessons)
- Bullish Rectangle
- Bearish Rectangle
- Double Top
- Double Bottom
- Triple Top
- Triple Bottom
- How to differentiate rectangle chart patterns
- Pole patterns (5 lessons)
- Bullish Flag
- Bearish Flag
- Bullish Pennant
- Bearish Pennant
- How to differentiate pole chart patterns
- Exotic patterns (4 lessons)
- Head And Shoulders
- Inverted Head And Shoulders
- Cup And Handle
- Inverted Cup And Handle
- Conclusion (1 lesson)
- chart patterns cheat sheet
Ready?
We think you are. Let's start with a chart pattern that we kind of explained already!
