Just like we did to differentiate triangle chart patterns, we will be using highs and lows as well as the trend prior to pattern formation to differentiate rectangle chart patterns too.
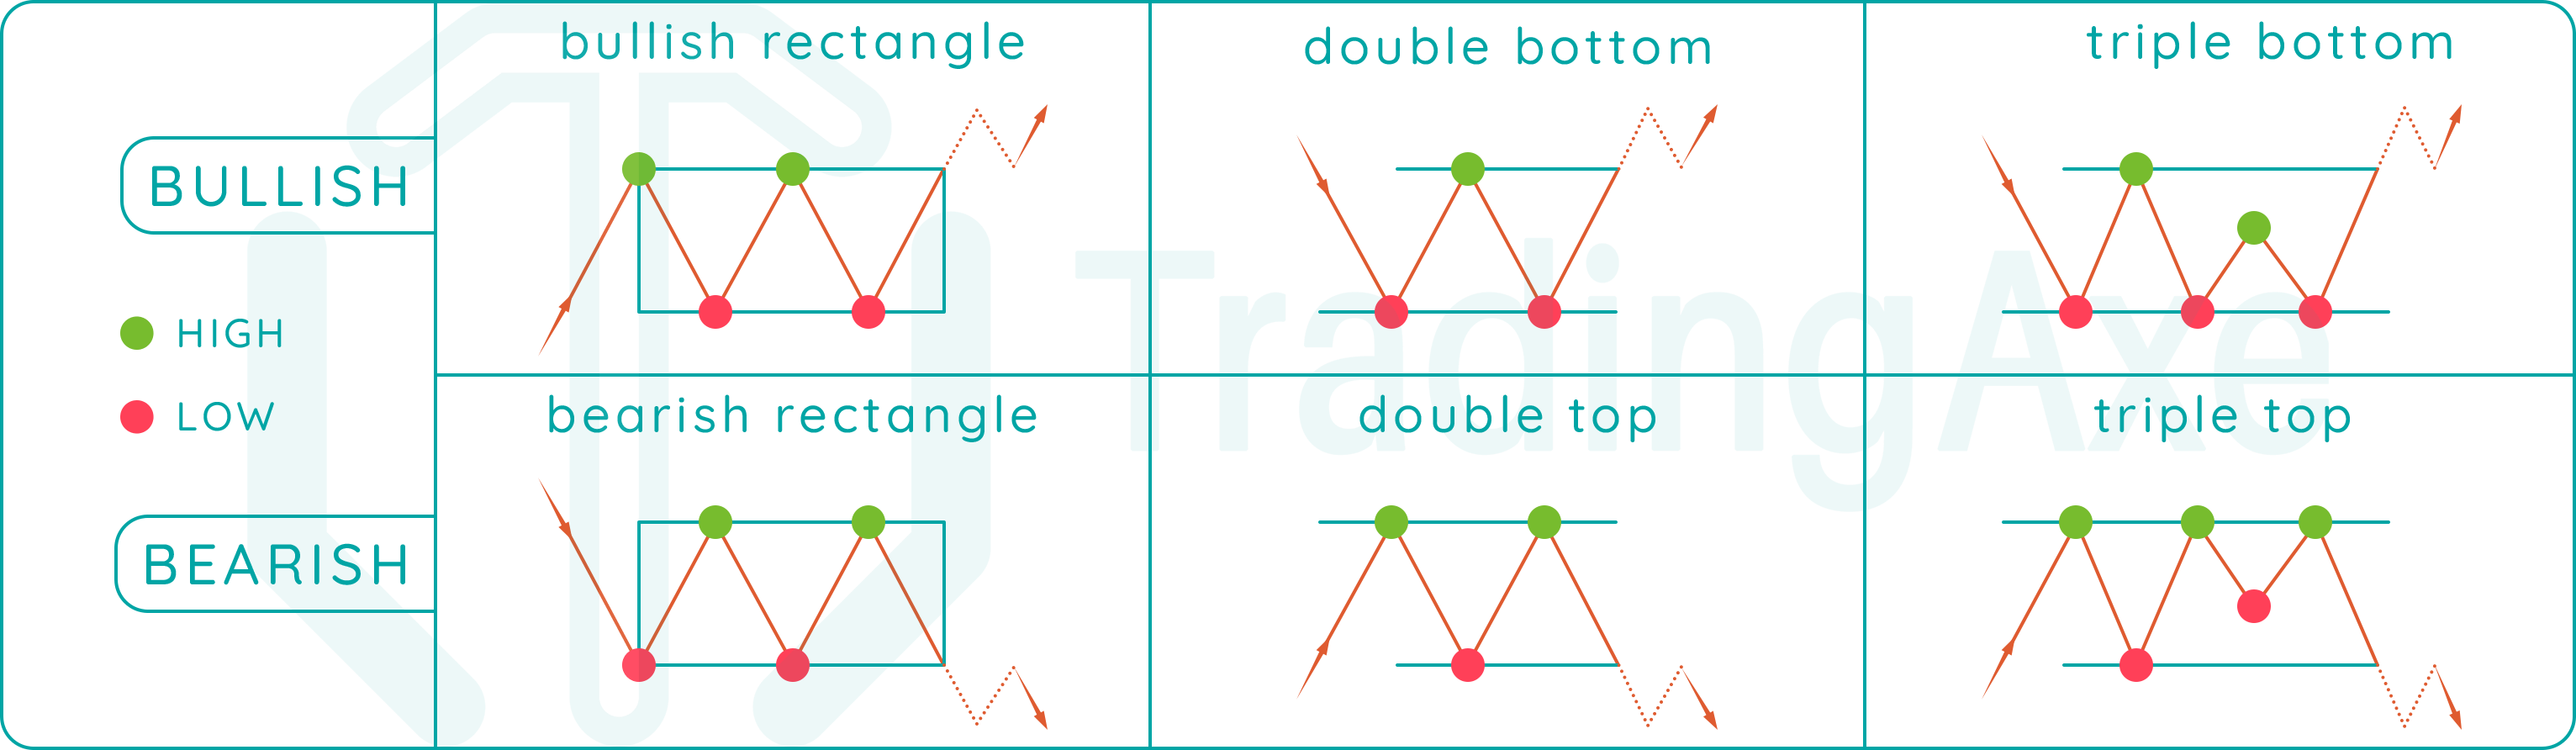
BULLISH RECTANGLE
Prior trend before pattern formation is bullish.
Highs inside the pattern formation are equal (around the same rate)
Lows inside the pattern formation are equal (around the same rate)
A minimum of two highs and two lows are required for a valid bullish rectangle pattern.
BEARISH RECTANGLE
Prior trend before pattern formation is bearish.
Highs inside the pattern formation are equal (around the same rate)
Lows inside the pattern formation are equal (around the same rate)
A minimum of two highs and two lows are required for a valid bearish rectangle pattern.
DOUBLE BOTTOM
Prior trend before pattern formation is bearish.
A single high inside the pattern formation.
Lows inside the pattern formation are equal (around the same rate)
Exactly two lows and one high are required for a valid double bottom pattern.
DOUBLE TOP
Prior trend before pattern formation is bullish.
Highs inside the pattern formation are equal (around the same rate)
A single low inside the pattern formation.
Exactly two highs and one low are required for a valid double top pattern.
TRIPLE BOTTOM
Prior trend before pattern formation is bearish.
Highs inside the pattern formation are unequal.
Lows inside the pattern formation are equal (around the same rate)
Exactly three lows and two highs are required for a valid triple bottom pattern.
TRIPLE TOP
Prior trend before pattern formation is bullish.
Highs inside the pattern formation are equal (around the same rate)
Lows inside the pattern formation are unequal.
Exactly three highs and two lows are required for a valid triple top pattern.
Let's summarize the unique characteristics for each rectangle-shaped chart pattern we discussed in this lesson.
| bullish rectangle | equal highs |
|---|---|
| equal lows | |
| prior trend: bullish | |
| bearish rectangle | equal highs |
| equal lows | |
| prior trend: bearish | |
| double bottom | single high |
| 2 equal lows | |
| prior trend: bearish | |
| double top | 2 equal highs |
| single low | |
| prior trend: bullish | |
| triple bottom | 2 unequal highs |
| 3 equal lows | |
| prior trend: bearish | |
| triple top | 3 equal highs |
| 2 unequal lows | |
| prior trend: bullish |