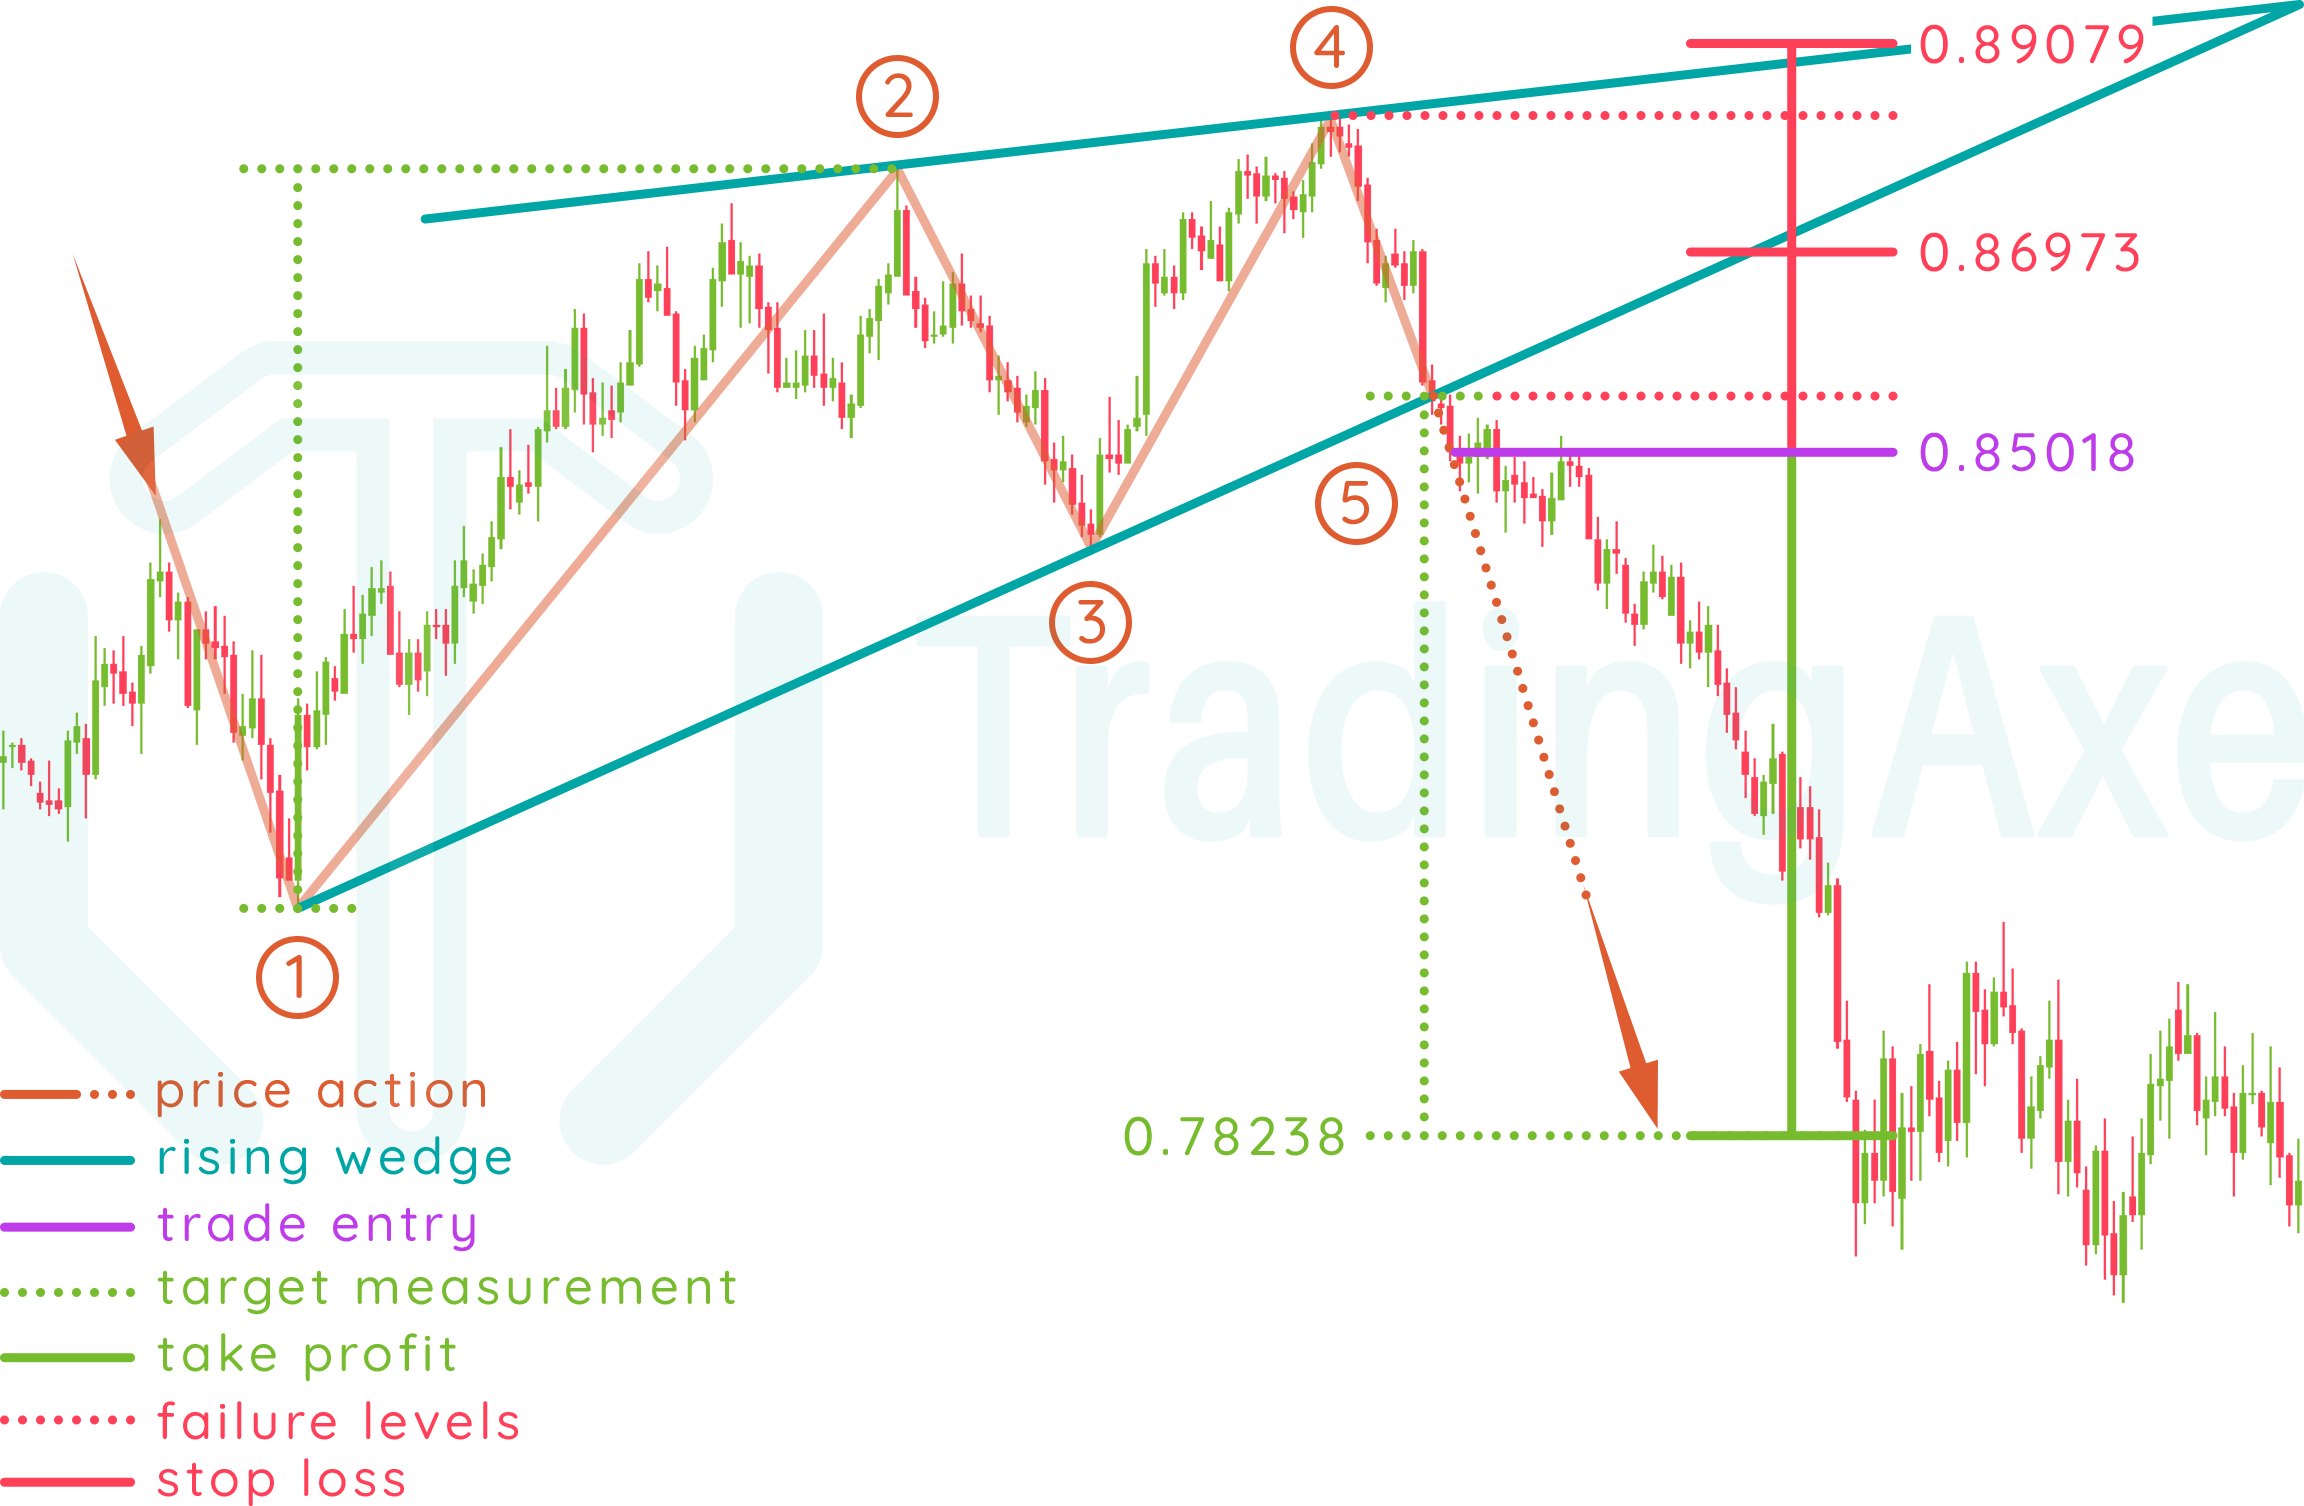
Entry: after breaking the wedge's lower border at point (5), either with an entry after the breakout, or after a possible retest of the lower border's breakout rate.
Take profit: identified by measuring the vertical distance between the first resistance (1) and the first support (2), that measurement is then applied from the breakout rate (5)
Stop loss: can either be the breakout rate (5), or the last touch to the wedge's upper border (4) before the breakout
RISING WEDGE PRICE ACTION
This chart pattern can be formed after either an uptrend or a downtrend. Bulls make the first move by creating a resistance and pushing the exchange rate upwards. As bears try to fight back, it looks like the bulls have the upper hand as higher lows and higher highs are being formed. However, bears suddenly start a downtrend by breaking the wedge's lower border resistance that was created by the bulls.
Let's break down the pattern formation!
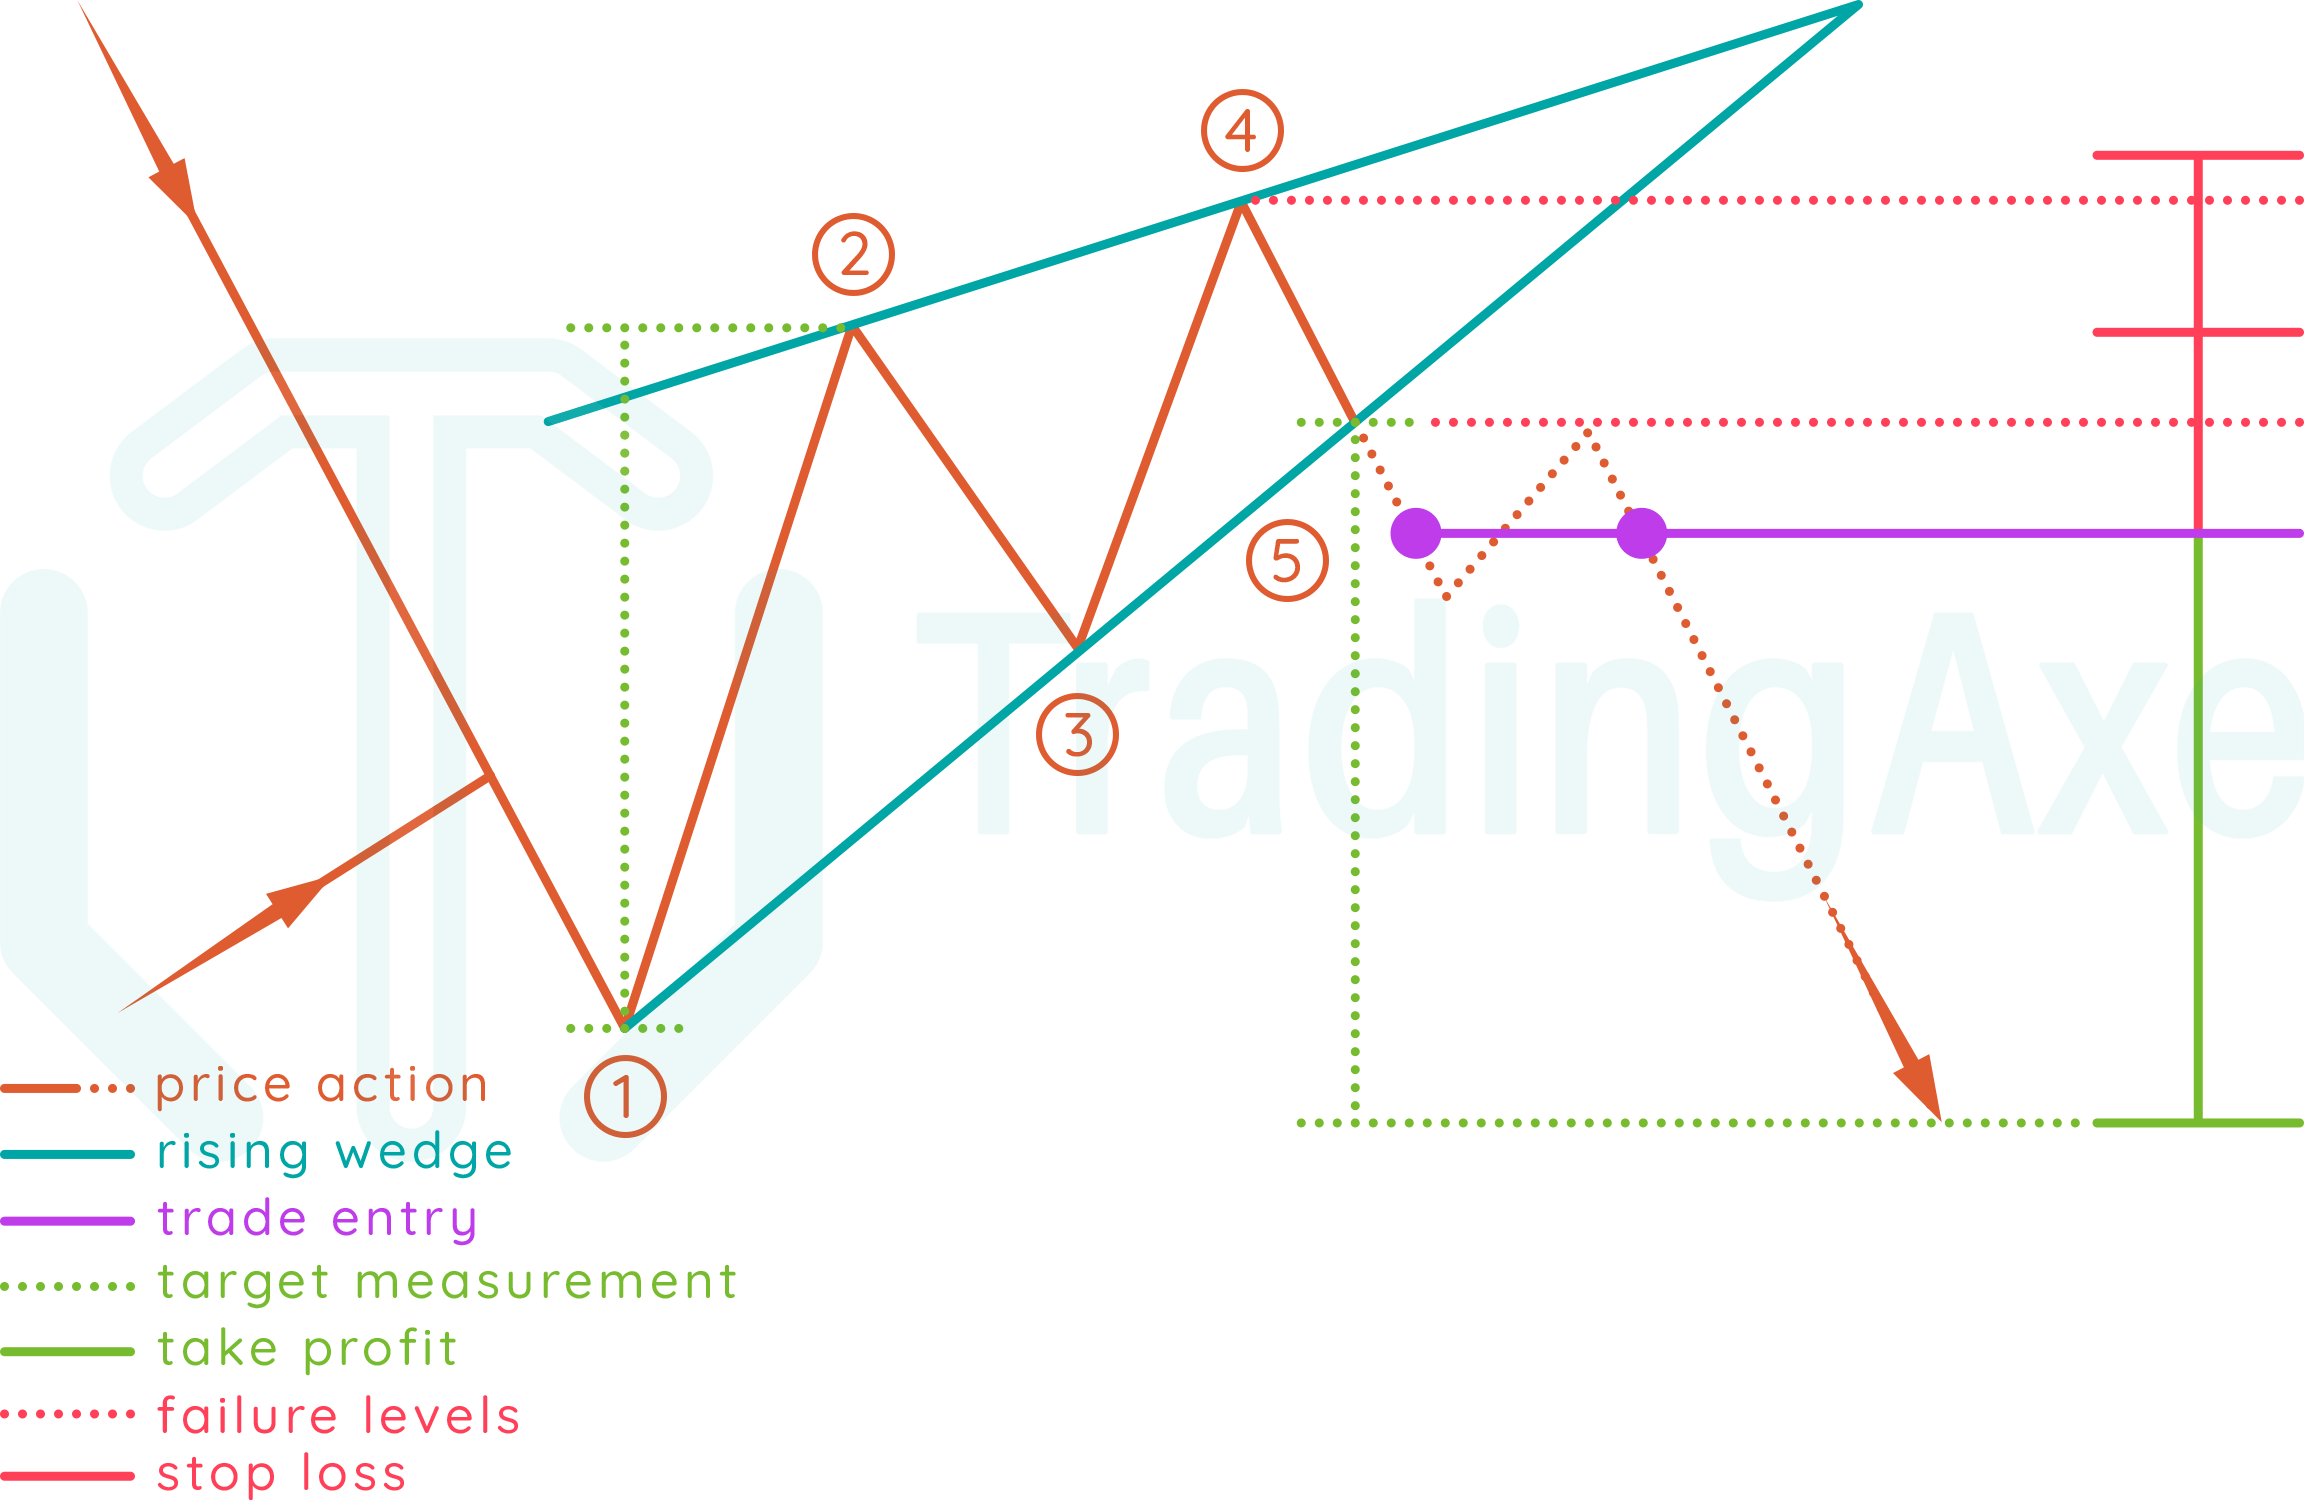
Price action finds the first resistance (1), which will be the lowest low in the pattern.
Price action reverses direction from the first resistance (1) and goes upwards till it finds the first support (2), which will be the lowest high in the pattern.
Price action reverses direction from the first support (2) and goes downwards, till it finds the second resistance (3), which must be higher than the first resistance (1)
Price action reverses direction from the second resistance (3) and goes upwards, till it finds the second support (4), which must be higher than the first support (2)
The pattern is completed when price action reverses direction from the second support (4) and goes downwards till it breaks the wedge's upper border at point (5)
NOTES ON RISING WEDGE
Direction
Neutral
Type
Bearish
Occurrence
Medium
Common term
All
Before the breakout, 4 touches to the wedge's upper and lower borders are the minimum for a valid pattern, more touches are acceptable.
For the pattern's shape to converge, the up-slope of the wedge's lower border (1-3-...) must be considerably sharper than that of the upper border (2-4-...). However, it is acceptable for a rising wedge pattern to form without both borders intersecting in the near future, the key point is that the wedge's lower border up-slope must be sharper than that of the wedge's upper border.
Since the price action inside the wedge formation is an uptrend, and since its target is a bearish one, the breakout volume should be considerably high to confirm that more bears are entering the market.
This pattern is commonly found on all time frames.
RISING WEDGE REWARD:RISK
The sharper the wedge's lower border up-slope than that of the upper border, the better the R:R.
R:R improves when the breakout is nearer to the wedge borders' intersection point.
Always remember that both stop loss levels explained above are absolute, the actual stop loss rate for your trade setup should be a bit beyond those levels to give the trade setup some room to breathe, and of course, calculations for position size and R:R should be done with respect to those rates.